En julio se produjo un cambio notable en la renta variable estadounidense. La venta masiva de los 7 magníficos de la tecnología provocó una divergencia entre los valores de crecimiento de gran capitalización y el segmento del mercado más orientado al valor y de menor capitalización. Nvidia y el resto de los 7 Magníficos han liderado el mercado durante gran parte del año, y sus fuertes caídas en julio arrastraron a la baja a los índices bursátiles más amplios. Mientras tanto, las empresas de pequeña capitalización y las áreas del mercado orientadas al valor registraron importantes ganancias durante el mismo periodo. Aunque esta rotación fuera de las megacapitalizaciones sólo ha surgido recientemente, esta tendencia podría tener recorrido, ya que muchos inversores parecen estar buscando ahora formas de reducir su exposición a los niveles históricos de concentración de los mercados de renta variable actuales.
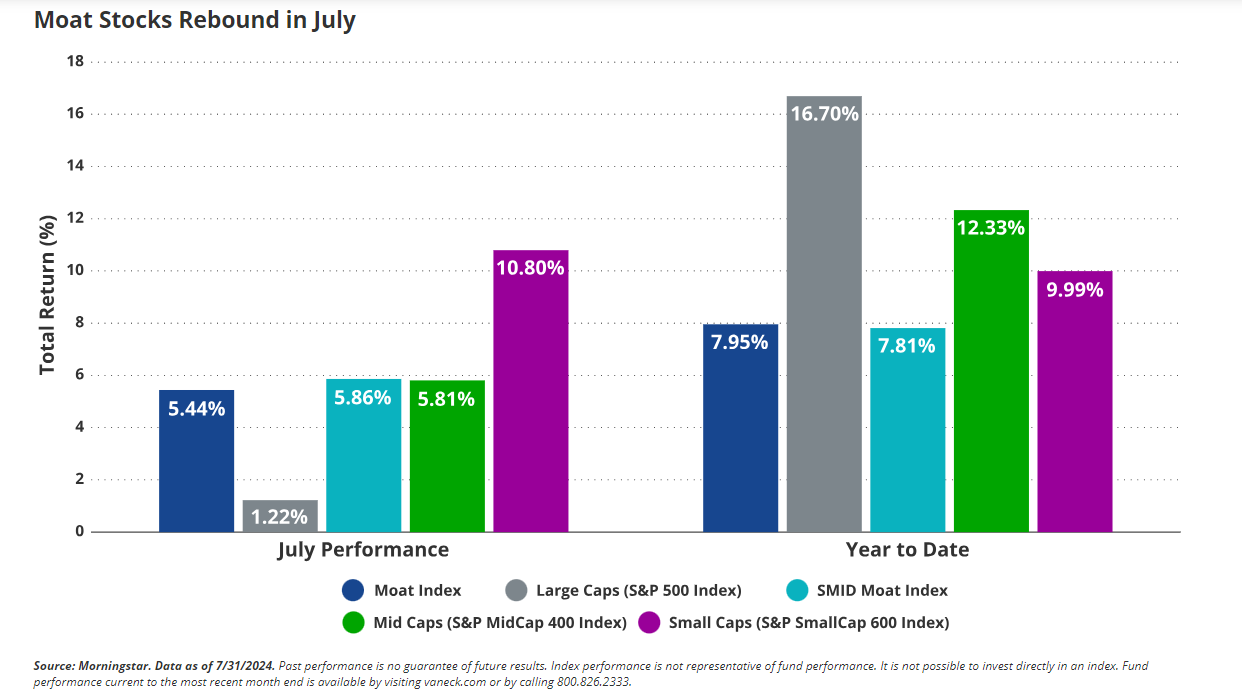
El Morningstar Wide Moat Focus Index (el «Moat Index») superó significativamente su rentabilidad en julio, ganando un 5,44% frente al 1,22% del S&P 500. Esta rentabilidad superior se debió a la infraponderación de las megacapitalizadas tecnológicas, así como a una sólida selección de valores, especialmente en el sector industrial. A continuación, se ofrece más información sobre los impulsores de la rentabilidad. En lo que va de año, el Moat Index sigue rezagado con respecto al S&P 500, dada su tendencia al valor y su infraponderación estructural de las megacapitalizadas, pero esta posición contraria puede resultar favorable en el futuro a medida que cambie la dinámica del mercado.
Tras meses de dificultades, los valores estadounidenses de pequeña capitalización experimentaron un notable cambio de tendencia en julio, con una subida del índice de referencia puro de pequeña capitalización superior al 10% y del índice de referencia de mediana capitalización de casi el 6%. El fuerte índice de precios al consumo (IPC) publicado el 11 de julio fue el principal catalizador de este repunte de las pequeñas empresas. El informe del IPC mostró una mayor relajación de la inflación, lo que aumentó las probabilidades implícitas en el mercado de un recorte de tipos en septiembre por parte de la Reserva Federal estadounidense. El Morningstar US Small-Mid Cap Moat Focus Index (el «SMID Moat Index«) fue a la zaga de los valores de pequeña capitalización, pero superó ligeramente a los de mediana capitalización en julio.

¿El comienzo de una rotación “magnífica”?
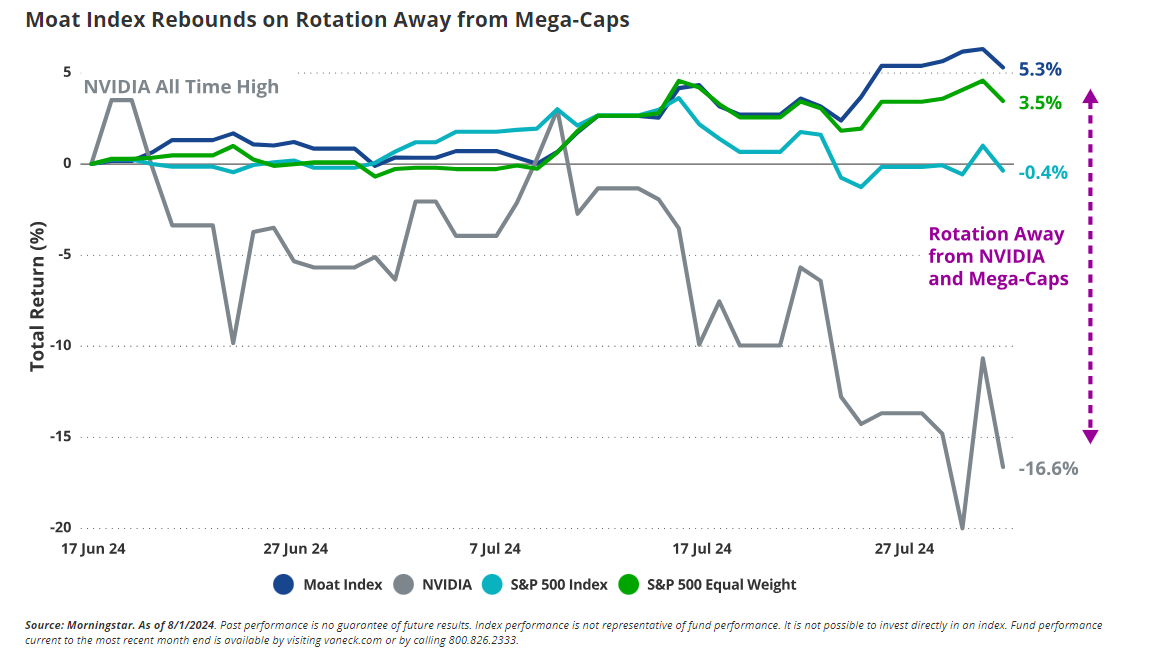
Gran parte de este año se ha caracterizado por niveles extremos de concentración en el mercado de renta variable estadounidense, impulsado por los 7 Magníficos y la obsesión en torno a la IA. En las últimas semanas, Nvidia y las tecnológicas de mega capitalización han tropezado en lo que podría caracterizarse como el inicio de una “Rotación Magnífica”. Las elevadas valoraciones y los interrogantes sobre cuándo empezarán a dar beneficios los enormes gastos de capital en IA han llevado a los inversores a retirar algunas fichas de la mesa y rotar hacia áreas del mercado más orientadas al valor.
Desde su máximo histórico de mediados de junio, Nvidia ha caído aproximadamente un 20% hasta principios de agosto, arrastrando al mercado en general, mientras que el índice Moat ha ganado más de un 5% durante el mismo periodo. El Índice Moat se ha beneficiado de su enfoque en empresas de alta calidad con valoraciones atractivas, lo que le ha llevado a un ligero sesgo de valor y le ha alejado de la tecnología de megacapitalización. El posicionamiento del Moat Index ha sido un viento en contra durante gran parte de 2024, pero ahora puede resultar beneficioso teniendo en cuenta la dinámica actual del mercado. Para ilustrar aún más el alejamiento de los 7 magníficos, la variante de igual ponderación del índice S&P 500 también subió durante el periodo; sin embargo, su metodología de baja convicción que asigna indiscriminadamente por igual a todos los 500 componentes quedó rezagada con respecto al Moat Index.

Lo más destacado del Índice Moat: Notable selección de valores
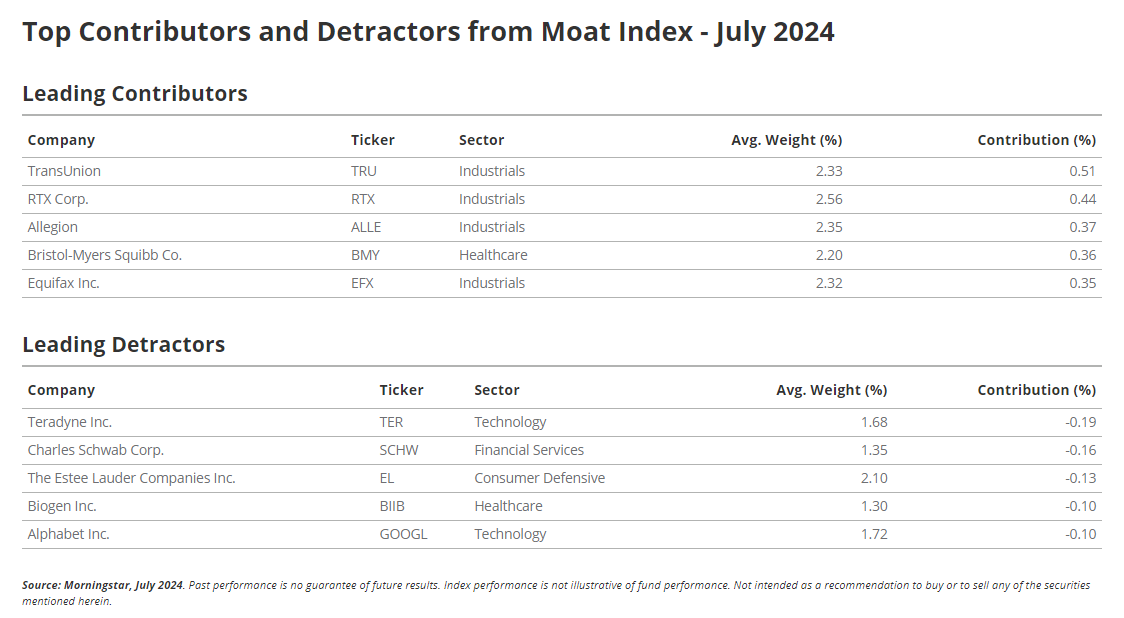
Más allá de la infraponderación de las megacapitales tecnológicas, la fuerte selección de valores dentro de la estrategia fue también un notable impulsor de la rentabilidad relativa en julio. El efecto de la selección durante el mes supuso más de 300 puntos básicos de rentabilidad superior frente al S&P 500. La mayor parte se atribuye a nombres industriales, que figuran en gran medida en la tabla de principales contribuyentes de este mes.
Las agencias de crédito al consumo TransUnion (TRU) y Equifax (EFX) fueron las que más contribuyeron a la rentabilidad durante el mes gracias a los buenos resultados del segundo trimestre, que hicieron subir a las acciones de TRU y EFX un 21% y un 15%, respectivamente. En cuanto a TransUnion, Rajiv Bhatia, analista de renta variable de Morningstar, mantuvo su estimación de valor razonable en 100 dólares, señalando que sigue considerando atractivo el perfil de riesgo/remuneración de las acciones de TRU. Otros valores que han contribuido al alza en el sector industrial son el fabricante aeroespacial y de defensa RTX y la empresa de productos de seguridad residencial y comercial Allegion (ALLE), que subieron más de un 15% en julio.
Los nombres que restaron puntos al Índice Moat este mes pertenecían en su mayoría al sector tecnológico, con el proveedor de equipos de automatización industrial Teradyne Inc. (TER) y el conocido conglomerado tecnológico de megacapitalización Alphabet (GOOGL) como principales detractores. Otros detractores son Charles Schwab (SCHW), el vendedor mundial de productos de belleza Estée Lauder (EL) y el fabricante de medicamentos Biogen (BIIB).

Lo más destacado del índice SMID Moat: Morningstar eleva la estimación del valor razonable de Allegion
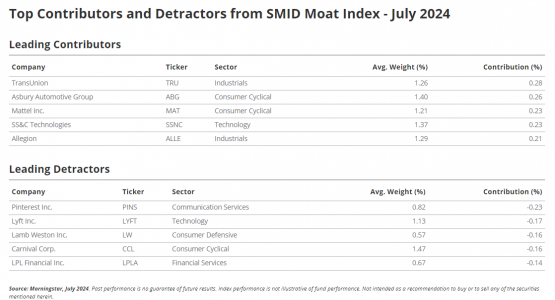
El índice SMID Moat de menor capitalización también se benefició de la mencionada TransUnion (TRU), ya que el rendimiento de julio de este valor de mediana capitalización también lideró el grupo de empresas SMID Moat. El concesionario regional de automóviles Asbury Automotive Group (ABG) también fue uno de los valores que más contribuyeron al alza, ya que sus acciones subieron más de un 18% a la espera de su informe de resultados trimestrales de principios de agosto. Allegion (ALLE), líder mundial en productos y soluciones de seguridad, fue otra de las empresas que más contribuyó al alza de sus acciones tras un sólido informe de resultados. Brian Bernard, de Morningstar, señaló que los resultados financieros de Allegion en el segundo trimestre superaron las expectativas, y que también se habían incrementado las previsiones. Brain elevó su estimación de valor razonable a 151 dólares por acción debido a unas perspectivas de crecimiento de los ingresos y de los márgenes de beneficio más optimistas a corto plazo.
Entre los nombres que más contribuyeron negativamente al rendimiento del SMID Moat Index durante el mes se encuentran la plataforma de comercio electrónico y contenidos de Internet Pinterest (PINS), el segundo mayor proveedor de servicios de transporte compartido de Norteamérica Lyft (LYFT), la empresa de alimentos envasados Lamb Weston (LW), la mayor empresa mundial de cruceros Carnival (CCL) y el corredor/agente independiente LPL Financial (LPLA), que cayeron todos dos dígitos en julio.

Tribuna de Coulter Regal, product manager de VanEck.
This content is intended for educational purposes only. Please note that the availability of the products mentioned may vary by country, and it is recommended to check with your local stock exchange.
Important Disclosures
Source for all data unless otherwise noted: Morningstar.
Fair value estimate: the Morningstar analyst’s estimate of what a stock is worth. Price/Fair Value: ratio of a stock’s trading price to its fair value estimate.
This is not an offer to buy or sell, or a recommendation to buy or sell any of the securities, financial instruments or digital assets mentioned herein. The information presented does not involve the rendering of personalized investment, financial, legal, tax advice, or any call to action. Certain statements contained herein may constitute projections, forecasts and other forward-looking statements, which do not reflect actual results, are for illustrative purposes only, are valid as of the date of this communication, and are subject to change without notice. Actual future performance of any assets or industries mentioned are unknown. Information provided by third party sources are believed to be reliable and have not been independently verified for accuracy or completeness and cannot be guaranteed. VanEck does not guarantee the accuracy of third party data. The information herein represents the opinion of the author(s), but not necessarily those of VanEck or its other employees.
Holdings will vary for the MOAT ETF and its corresponding Index. For a complete list of holdings in the ETF, please click here: MOAT – VanEck Morningstar Wide Moat ETF – Holdings.
Holdings will vary for the SMOT ETF and its corresponding Index. For a complete list of holdings in the ETF, please click here: SMOT – VanEck Morningstar SMID Moat ETF – Holdings.
Holdings will vary for the MGRO ETF and its corresponding Index. For a complete list of holdings in the ETF, please click here: MGRO – VanEck Morningstar Wide Moat Growth ETF – Holdings.
Holdings will vary for the MVAL ETF and its corresponding Index. For a complete list of holdings in the ETF, please click here: MVAL – VanEck Morningstar Wide Moat Value ETF – Holdings.
An investor cannot invest directly in an index. Returns reflect past performance and do not guarantee future results. Results reflect the reinvestment of dividends and capital gains, if any. Certain indices may take into account withholding taxes. Index returns do not represent Fund returns. The Index does not charge management fees or brokerage expenses, nor does the Index lend securities, and no revenues from securities lending were added to the performance shown.
The Morningstar® Wide Moat Focus IndexSM and Morningstar® US Small-Mid Cap Moat Focus IndexSM were created and are maintained by Morningstar, Inc. Morningstar, Inc. does not sponsor, endorse, issue, sell, or promote the VanEck Morningstar Wide Moat ETF or the VanEck Morningstar SMID Moat ETF and bears no liability with respect to the ETFs or any security. Morningstar® is a registered trademark of Morningstar, Inc. Morningstar® Wide Moat Focus IndexSM and Morningstar® US Small-Mid Cap Moat Focus IndexSM are service marks of Morningstar, Inc
The Morningstar® US Broad Value Wide Moat Focus IndexSM and Morningstar® US Broad Growth Wide Moat Focus IndexSM were created and are maintained by Morningstar, Inc. Morningstar, Inc. does not sponsor, endorse, issue, sell, or promote the VanEck Morningstar Wide Moat Value ETF and VanEck Morningstar Wide Moat Growth ETF and bears no liability with respect to the Funds or any security. Morningstar® is a registered trademark of Morningstar, Inc. Morningstar® US Broad Value Wide Moat Focus IndexSM and Morningstar® US Broad Growth Wide Moat Focus IndexSM are service marks of Morningstar, Inc.
Effective June 20, 2016, Morningstar implemented several changes to the Morningstar Wide Moat Focus Index construction rules. Among other changes, the index increased its constituent count from 20 stocks to at least 40 stocks and modified its rebalance and reconstitution methodology. These changes may result in more diversified exposure, lower turnover, and longer holding periods for index constituents than under the rules in effect prior to this date. Past performance is no guarantee of future results.
The Morningstar moat-driven indexes represent various regional exposures and consist of companies identified as having sustainable, competitive advantages and whose stocks are attractively priced, according to Morningstar.
The Morningstar® Wide Moat Focus IndexSM is intended to track the overall performance of attractively priced companies with sustainable competitive advantages according to Morningstar’s equity research team.
The Morningstar® US Small-Mid Cap Moat Focus IndexSM is intended to track the overall performance of small- and mid-cap companies with sustainable competitive advantages and attractive valuations according to Morningstar’s equity research team.
Morningstar® US Broad Value Wide Moat Focus IndexSM: consists of at least 30 U.S. value-oriented companies identified as having sustainable, competitive advantages, and whose stocks are the most attractively priced, according to Morningstar.
Morningstar® US Broad Growth Wide Moat Focus IndexSM: consists of at least 30 U.S. growth-oriented companies identified as having sustainable, competitive advantages, and whose stocks are the most attractively priced, according to Morningstar.
The S&P SmallCap 600 Index represents small-cap US companies. The S&P Midcap 400 Index provides investors with a benchmark for mid-sized US companies. The S&P 500 Index tracks the stock performance of 500 of the largest companies listed on stock exchanges in the United States. The S&P 500 Equal Weighted Index which is an equally weighted version of the market-cap weighted S&P 500 Index. The Dow Jones Industrial Average, Dow Jones, or simply the Dow, is a stock market index of 30 prominent companies listed on stock exchanges in the United States. Nasdaq Composite is a stock market index that includes almost all stocks listed on the Nasdaq stock exchange.
The S&P 500® Index is a product of S&P Dow Jones Indices LLC and/or its affiliates and has been licensed for use by Van Eck Associates Corporation. Copyright ©2024 S&P Dow Jones Indices LLC, a division of S&P Global, Inc., and/or its affiliates. All rights reserved. Redistribution or reproduction in whole or in part are prohibited without written permission of S&P Dow Jones Indices LLC. For more information on any of S&P Dow Jones Indices LLC’s indices please visit www.spdji.com. S&P® is a registered trademark of S&P Global and Dow Jones® is a registered trademark of Dow Jones Trademark Holdings LLC. Neither S&P Dow Jones Indices LLC, Dow Jones Trademark Holdings LLC, their affiliates nor their third party licensors make any representation or warranty, express or implied, as to the ability of any index to accurately represent the asset class or market sector that it purports to represent and neither S&P Dow Jones Indices LLC, Dow Jones Trademark Holdings LLC, their affiliates nor their third party licensors shall have any liability for any errors, omissions, or interruptions of any index or the data included therein.
An investment in the VanEck Morningstar Wide Moat ETF (MOAT®) may be subject to risks which include, among others, risks related to investing in equity securities, health care sector, industrials sector, information technology sector, financials sector, medium-capitalization companies, market, operational, high portfolio turnover, index tracking, authorized participant concentration, no guarantee of active trading market, trading issues, passive management, fund shares trading, premium/discount risk and liquidity of fund shares, non-diversification and index-related concentration risks, all of which may adversely affect the Fund. Medium-capitalization companies may be subject to elevated risks.
An investment in the VanEck Morningstar SMID Moat ETF (SMOT®) may be subject to risks which include, among others, risks related to investing in equity securities, small- and medium-capitalization companies, consumer discretionary sector, financials sector, health care sector, industrials sector, information technology sector, market, operational, high portfolio turnover, index tracking, authorized participant concentration, no guarantee of active trading market, trading issues, passive management, fund shares trading, premium/discount risk and liquidity of fund shares, non-diversified, and index-related concentration risks, all of which may adversely affect the Fund. Small- and medium-capitalization companies may be subject to elevated risks.
An investment in the VanEck Morningstar Wide Moat Value ETF (MVAL) may be subject to risks which include, among others, risks related to investing in equity securities, value style investing, financials sector, health care sector, industrials sector, large- and medium-capitalization companies, market, operational, index tracking, authorized participant concentration, new fund, no guarantee of active trading market, trading issues, passive management, fund shares trading, premium/discount and liquidity of fund shares, non-diversified, and index-related concentration risks, all of which may adversely affect the Fund. Large- and medium-capitalization companies may be subject to elevated risks. The Fund’s value strategy may result in the Fund investing in securities or industry sectors that underperform the market as a whole. Furthermore, the value companies identified by the Index provider may not operate as expected, and there is no guarantee that the index provider’s proprietary valuation model will perform as intended.
An investment in the VanEck Morningstar Wide Moat Growth ETF (MGRO) may be subject to risks which include, among others, risks related to investing in equity securities, growth style investing, consumer discretionary sector, industrials sector, financials sector, large- and medium-capitalization companies, health care sector, information technology sector, market, operational, index tracking, authorized participant concentration, new fund, no guarantee of active trading market, trading issues, passive management, fund shares trading, premium/discount and liquidity of fund shares, non-diversified, and index-related concentration risk, all of which may adversely affect the Fund. Large- and medium-capitalization companies may be subject to elevated risks. The Fund’s growth strategy may result in the Fund investing in securities or industry sectors that underperform the market as a whole. Furthermore, the growth companies identified by the Index provider may not operate as expected, and there is no guarantee that the index provider’s proprietary valuation model will perform as intended.
Investing involves substantial risk and high volatility, including possible loss of principal. An investor should consider the investment objective, risks, charges and expenses of a Fund carefully before investing. To obtain a prospectus and summary prospectus, which contain this and other information, call 800.826.2333 or visit vaneck.com. Please read the prospectus and summary prospectus carefully before investing.
© Van Eck Securities Corporation, Distributor, a wholly owned subsidiary of Van Eck Associates Corporation.


