Después de tres años de obstáculos, como una inflación elevada y las subidas de los tipos de interés, creemos que el mercado de renta fija estadounidense se encuentra bien posicionado de cara a 2024. Ahora que la Reserva Federal (Fed) parece haber terminado de subir los tipos y la inflación subyacente tiende a descender, creemos que las0 perspectivas de la renta fija estadounidense parecen positivas. En nuestra opinión, los inversores pueden cosechar ahora los beneficios de unas rentabilidades iniciales más altas, con un bajo riesgo de que los tipos suban (y los precios de los bonos bajen) más a partir de ahora.
Los siguientes gráficos muestran cinco consideraciones esenciales para los inversores en renta fija de cara al nuevo año.
Gráfico 1. Tras el contundente ciclo de subidas de tipos de la Fed, la renta fija estadounidense ofrece ahora los rendimientos más atractivos desde antes de la crisis financiera mundial. No solo los rendimientos nominales son más altos, sino que los bonos no han estado tan baratos con respecto a la renta variable desde hace más de dos décadas.
Como muestra el gráfico 1, el índice S&P 500® no ofrece actualmente remuneración adicional a los inversores por asumir el riesgo de la renta variable en relación con la renta fija. Creemos que esta situación dice menos sobre las condiciones de los mercados de renta variable que del valor de la renta fija.
En nuestra opinión, se trata de una evolución positiva: los inversores con aversión al riesgo que buscan rentas no necesitan asumir un riesgo adicional para satisfacer sus necesidades de rentabilidad. Recomendamos a los inversores que aprovechen este buen punto de entrada para llevar sus asignaciones a la renta fija hasta la ponderación de referencia, o hasta la sobreponderación, dependiendo su situación individual y su tolerancia al riesgo.
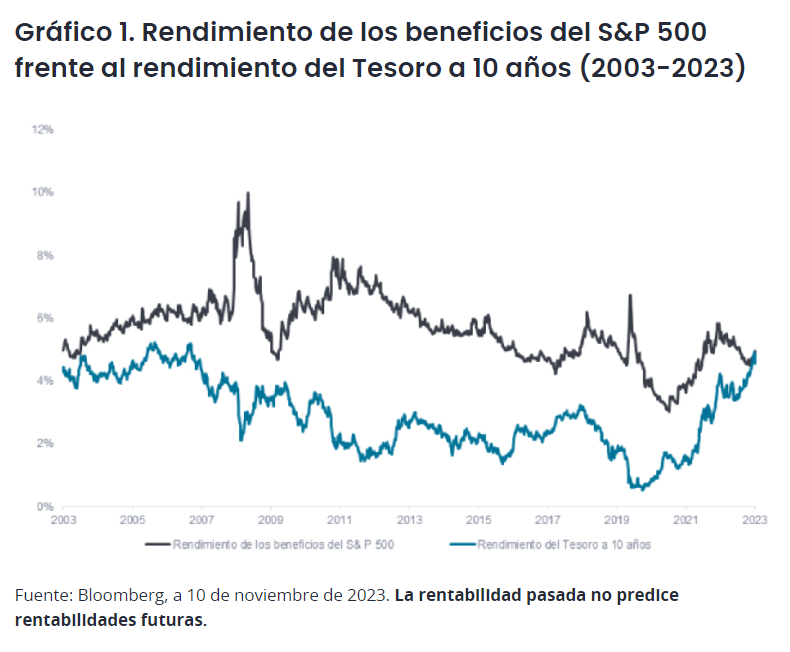
Gráfico 2. Los rendimientos reales de los bonos son reales. Durante gran parte de la década que siguió a la crisis financiera mundial, los inversores podían aducir argumentos en contra de una sobreponderación a la renta fija debido a que los rendimientos reales (rendimientos nominales menos la inflación) estaban cerca o por debajo de cero. Pero la combinación de unos tipos de interés más altos y la caída de la inflación ha cambiado el panorama.
Los bonos del Tesoro superan ahora cómodamente el obstáculo de la inflación y ofrecen a los inversores rendimientos por encima de la inflación comparables a los de 2006-2007. Además, los sectores con diferenciales de crédito ―es decir, los bonos que pagan un rendimiento adicional por encima del tipo del Tesoro― como la deuda corporativa y los activos titulizados, están ofreciendo rendimientos reales incluso más altos, lo que supone una ventaja adicional para los inversores.
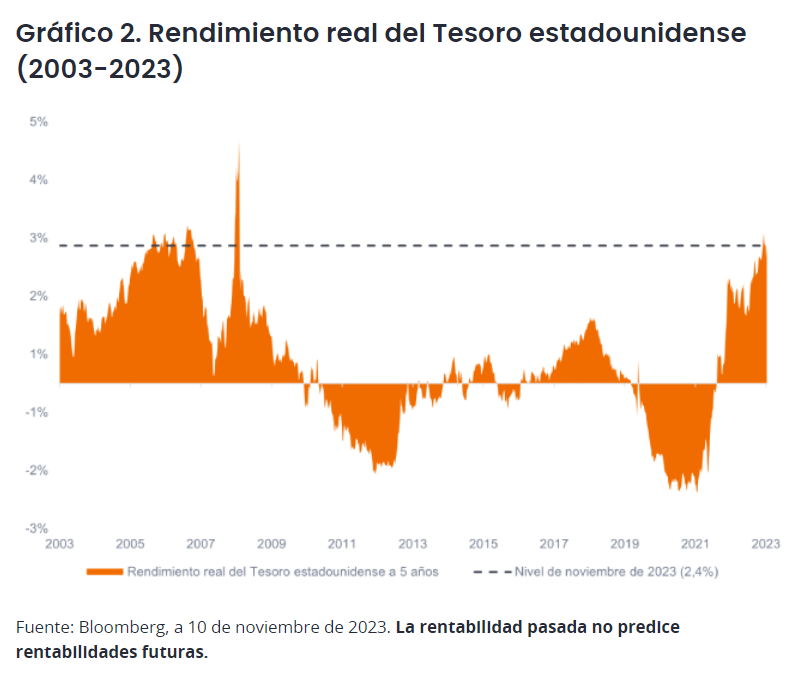
Gráfico 3. La vapuleada duración está de vuelta. Los activos de larga duración se han enfrentado a duros obstáculos desde que la Fed empezó a subir los tipos de interés hace casi dos años. A medida que los tipos han ido subiendo, los precios de los bonos de larga duración (con mayor riesgo de tipos de interés) han caído más que los bonos de baja duración.
Tras sufrir pérdidas en sus carteras de bonos core, muchos inversores se pasaron al efectivo, o a los mercados monetarios, para protegerse de la subida de los tipos. Pero ahora que nos encontramos al final del ciclo de subidas, los inversores deben tener cuidado con una duración demasiado corta conforme avanzamos hacia la siguiente fase del ciclo económico.
Como vemos en el gráfico 3, tras la última subida de tipos de los seis últimos ciclos de subidas, los bonos de duración superaron a los mercados monetarios. Bajo nuestro punto de vista, si los tipos en niveles altos durante más tiempo provoca una desaceleración económica, con un ajuste a la baja de los mercados de renta variable, los inversores se beneficiarían del contrapeso de la revalorización de los bonos.
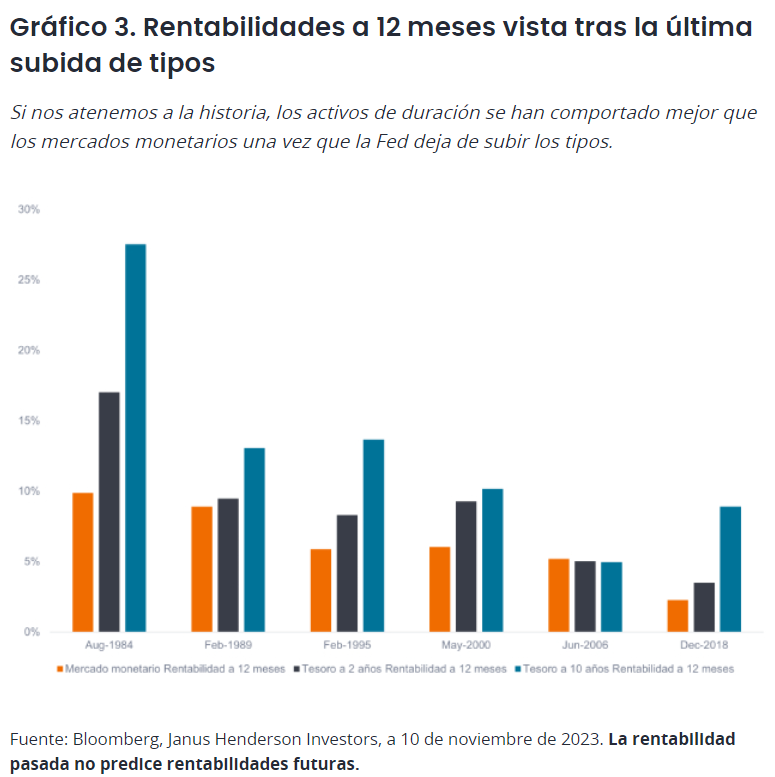
Gráfico 4. La caída de la inflación puede ser buena para las correlaciones entre acciones y bonos. Una razón fundamental para poseer renta fija es su correlación históricamente baja con la renta variable. Como se muestra en el gráfico 4, la correlación a 3 años entre el índice S&P 500 y el Tesoro estadounidense a 10 años ha sido mayoritariamente positiva cuando la inflación subyacente media a 3 años supera el 3%. En los últimos doce meses, la renta fija se ha movido en gran medida en la misma dirección que la renta variable y, por tanto, las asignaciones de renta fija no han amortiguado la volatilidad general de la cartera como esperarían los inversores.
No obstante, la correlación negativa ha vuelto habitualmente cuando la inflación subyacente media a tres años ha caído por debajo del 3%. A medida que la inflación siga cayendo y la Fed siga comprometida con su objetivo del 2%, pensamos que las correlaciones pueden volver a ser negativas, con el correspondiente retorno de las ventajas de diversificación de poseer bonos junto con acciones.
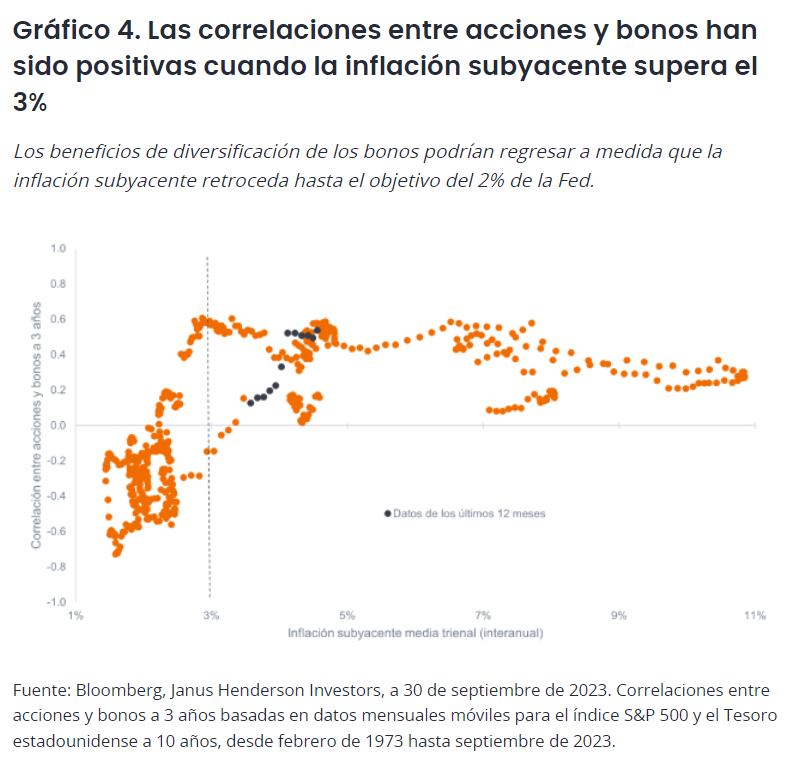
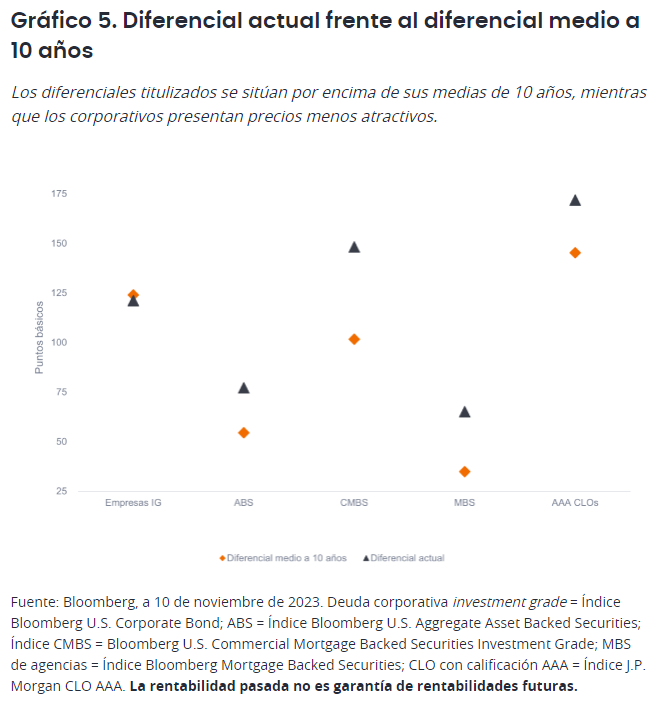
Gráfico 5. Las valoraciones del sector de titulizaciones parecen atractivas. Aunque los rendimientos han subido de forma generalizada, es importante recordar que los rendimientos de los bonos se componen de dos elementos: el rendimiento de la deuda pública sin riesgo más un rendimiento adicional ―o diferencial de crédito― que se paga a los inversores para compensarles por el mayor riesgo del valor.
Es importante evaluar las valoraciones de los diferenciales sectoriales en relación con sus niveles históricos, así como en relación con otros sectores, para determinar qué sectores parecen baratos en términos relativos.
Como se ve en el gráfico 5, los diferenciales de crédito titulizado se sitúan muy por encima de sus medias de 10 años, mientras que la deuda corporativa investment grade presenta precios menos atractivos. Si equiparamos estos niveles de precios al riesgo de recesión, los sectores de titulizaciones ya están descontando un cierto nivel de recesión, mientras que la deuda corporativa investment grade descuentan un aterrizaje suave. En nuestra opinión, esta divergencia en los diferenciales de crédito ha creado la oportunidad de obtener mayores rentabilidades ajustadas al riesgo en los sectores de titulizaciones.
Cuando los inversores miren hacia 2024, será importante recordar que en el punto en el que nos encontramos hoy en los mercados de renta fija es muy diferente a donde hemos estado en los dos años anteriores. Bajo nuestro punto de vista, los obstáculos se han disipado y los mercados de renta fija se han ajustado a un régimen de tipos de interés más altos. Con los rendimientos atractivos disponibles, el fin del ciclo de subidas de la Fed, la caída de la inflación y unos diferenciales de crédito históricamente amplios en los sectores de titulizaciones, prevemos unas altas rentabilidades nominales y reales en la renta fija multisectorial en 2024.
Tribuno de opinión de John Lloyd, gestor de carteras de Janus Henderson Investors.
FOOTNOTES AND DEFINITIONS
10-Year Treasury Yield is the interest rate on U.S. Treasury bonds that will mature 10 years from the date of purchase.
Asset-backed securities (ABS): A financial security that is ‘backed’ (or collateralized) with existing assets (such as loans, credit card debts or leases), usually ones that generate some form of income (cash flow) over time.
Basis point (bp) equals 1/100 of a percentage point. 1 bp = 0.01%, 100 bps = 1%.
The Bloomberg U.S. Aggregate Asset Backed Securities (ABS) Index tracks fixed rate, investment-grade asset-backed securities. The index has three subsectors: credit and credit cards, autos, and utility.
The Bloomberg US Commercial Mortgage Backed Securities (CMBS) Investment Grade Index measures the investment-grade market of US Agency and US Non-Agency conduit and fusion CMBS deals with a minimum current deal size of $300mn.
The Bloomberg US Corporate Bond Index measures the investment grade, fixed-rate, taxable corporate bond market. It includes USD denominated securities publicly issued by US and non-US industrial, utility and financial issuers.
Bloomberg US Mortgage Backed Securities (MBS) Index measures the performance of U.S. fixed-rate agency mortgage backed pass-through securities.
Collateralized Loan Obligation (CLO): A bundle of generally lower quality leveraged loans to companies that are grouped together into a single security, which generates income (debt payments) from the underlying loans. The regulated nature of the bonds that CLOs hold means that in the event of default, the investor is near the front of the queue to claim on a borrower’s assets.
Commercial mortgage-backed securities (CMBS): fixed-income investment products that are backed by mortgages on commercial properties rather than residential real estate.
Credit Spread is the difference in yield between securities with similar maturity but different credit quality. Widening spreads generally indicate deteriorating creditworthiness of corporate borrowers, and narrowing indicate improving.
Correlation measures the degree to which two variables move in relation to each other. A value of 1.0 implies movement in parallel, -1.0 implies movement in opposite directions, and 0.0 implies no relationship.
Duration measures a bond price’s sensitivity to changes in interest rates. The longer a bond’s duration, the higher its sensitivity to changes in interest rates and vice versa.
Investment-grade bond: A bond typically issued by governments or companies perceived to have a relatively low risk of defaulting on their payments, reflected in the higher rating given to them by credit ratings agencies.
J.P. Morgan CLO AAA Index is a subset of the CLOIE index that only tracks the AAA rated CLO. J.P. Morgan Collateralized Loan Obligation Index (CLOIE) is comprised of US dollar denominated broadly syndicated arbitrage CLOs.
Mortgage-backed security (MBS): A security which is secured (or ‘backed’) by a collection of mortgages. Investors receive periodic payments derived from the underlying mortgages, similar to the coupon on bonds. Similar to an asset-backed security. Mortgage-backed securities may be more sensitive to interest rate changes. They are subject to ‘extension risk’, where borrowers extend the duration of their mortgages as interest rates rise, and ‘prepayment risk’, where borrowers pay off their mortgages earlier as interest rates fall. These risks may reduce returns.
A real yield is calculated by subtracting the expected inflation rate from a bond’s nominal yield.
S&P 500® Index reflects U.S. large-cap equity performance and represents broad U.S. equity market performance.
IMPORTANT INFORMATION
Diversification neither assures a profit nor eliminates the risk of experiencing investment losses.
Fixed income securities are subject to interest rate, inflation, credit and default risk. The bond market is volatile. As interest rates rise, bond prices usually fall, and vice versa. The return of principal is not guaranteed, and prices may decline if an issuer fails to make timely payments or its credit strength weakens.
Securitized products, such as mortgage- and asset-backed securities, are more sensitive to interest rate changes, have extension and prepayment risk, and are subject to more credit, valuation and liquidity risk than other fixed-income securities.
References made to individual securities do not constitute a recommendation to buy, sell or hold any security, investment strategy or market sector, and should not be assumed to be profitable. Janus Henderson Investors, its affiliated advisor, or its employees, may have a position in the securities mentioned
Footnotes and definitions
Footnotes and definitions
The views presented are as of the date published. They are for information purposes only and should not be used or construed as investment, legal or tax advice or as an offer to sell, a solicitation of an offer to buy, or a recommendation to buy, sell or hold any security, investment strategy or market sector. Nothing in this material shall be deemed to be a direct or indirect provision of investment management services specific to any client requirements. Opinions and examples are meant as an illustration of broader themes, are not an indication of trading intent, are subject to change and may not reflect the views of others in the organization. It is not intended to indicate or imply that any illustration/example mentioned is now or was ever held in any portfolio. No forecasts can be guaranteed and there is no guarantee that the information supplied is complete or timely, nor are there any warranties with regard to the results obtained from its use. Janus Henderson Investors is the source of data unless otherwise indicated, and has reasonable belief to rely on information and data sourced from third parties. Past performance does not predict future returns. Investing involves risk, including the possible loss of principal and fluctuation of value.
Not all products or services are available in all jurisdictions. This material or information contained in it may be restricted by law, may not be reproduced or referred to without express written permission or used in any jurisdiction or circumstance in which its use would be unlawful. Janus Henderson is not responsible for any unlawful distribution of this material to any third parties, in whole or in part. The contents of this material have not been approved or endorsed by any regulatory agency.
Janus Henderson Investors is the name under which investment products and services are provided by the entities identified in the following jurisdictions: (a) Europe by Janus Henderson Investors International Limited (reg no. 3594615), Janus Henderson Investors UK Limited (reg. no. 906355), Janus Henderson Fund Management UK Limited (reg. no. 2678531), (each registered in England and Wales at 201 Bishopsgate, London EC2M 3AE and regulated by the Financial Conduct Authority) and Janus Henderson Investors Europe S.A. (reg no. B22848 at 2 Rue de Bitbourg, L-1273, Luxembourg and regulated by the Commission de Surveillance du Secteur Financier); (b) the U.S. by SEC registered investment advisers that are subsidiaries of Janus Henderson Group plc; (c) Canada through Janus Henderson Investors US LLC only to institutional investors in certain jurisdictions; (d) Singapore by Janus Henderson Investors (Singapore) Limited (Co. registration no. 199700782N). This advertisement or publication has not been reviewed by Monetary Authority of Singapore; (e) Hong Kong by Janus Henderson Investors Hong Kong Limited. This material has not been reviewed by the Securities and Futures Commission of Hong Kong; (f) South Korea by Janus Henderson Investors (Singapore) Limited only to Qualified Professional Investors (as defined in the Financial Investment Services and Capital Market Act and its sub-regulations); (g) Japan by Janus Henderson Investors (Japan) Limited, regulated by Financial Services Agency and registered as a Financial Instruments Firm conducting Investment Management Business, Investment Advisory and Agency Business and Type II Financial Instruments Business; (h) Australia and New Zealand by Janus Henderson Investors (Australia) Limited (ABN 47 124 279 518) and its related bodies corporate including Janus Henderson Investors (Australia) Institutional Funds Management Limited (ABN 16 165 119 531, AFSL 444266) and Janus Henderson Investors (Australia) Funds Management Limited (ABN 43 164 177 244, AFSL 444268); (i) the Middle East by Janus Henderson Investors International Limited, regulated by the Dubai Financial Services Authority as a Representative Office. This document relates to a financial product which is not subject to any form of regulation or approval by the Dubai Financial Services Authority («DFSA»). The DFSA has no responsibility for reviewing or verifying any prospectus or other documents in connection with this financial product. Accordingly, the DFSA has not approved this document or any other associated documents nor taken any steps to verify the information set out in this document, and has no responsibility for it. The financial product to which this document relates may be illiquid and/or subject to restrictions on its resale. Prospective purchasers should conduct their own due diligence on the financial product. If you do not understand the contents of this document you should consult an authorised financial adviser. No transactions will be concluded in the Middle East and any enquiries should be made to Janus Henderson. We may record telephone calls for our mutual protection, to improve customer service and for regulatory record keeping purposes.
Outside of the U.S.: For use only by institutional, professional, qualified and sophisticated investors, qualified distributors, wholesale investors and wholesale clients as defined by the applicable jurisdiction. Not for public viewing or distribution. Marketing Communication.
Janus Henderson and Knowledge Shared are trademarks of Janus Henderson Group plc or one of its subsidiaries. © Janus Henderson Group plc.
D10520


