In a financial environment marked by evolving generational preferences and constant technological innovation, asset securitization emerges as a strategic tool for the new generation of asset managers. As younger investors gain access to financial advice earlier—and with different demands—managers face the need to adapt products, operating models, and distribution channels. Securitization, traditionally associated with complex structures and institutional investors, is finding renewed relevance in service of this transformation, according to FlexFunds.
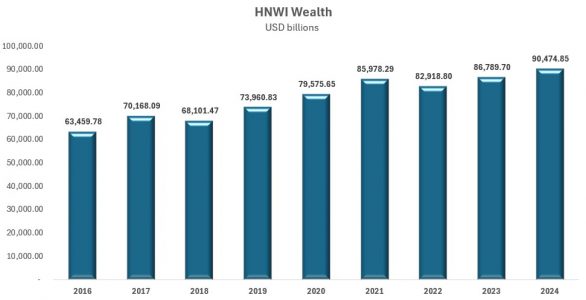
During 2024, the growth in wealth and the population of high-net-worth individuals (HNWI) worldwide was solid, with increases of 4.2 % and 2.6 %, respectively. However, the real inflection point for the sector is the imminent, massive wealth transfer to Generation X, Millennials, and Generation Z—collectively known as next‑generation HNWIs. It is estimated that by 2048, more than US $83.5 trillion will have been transferred to these cohorts, marking a structural shift in the wealth‑management landscape.
According to Capgemini’s World Report Series 2025: Wealth Management, this phenomenon is occurring alongside a strong stock‑market rebound which, despite macroeconomic volatility, drove sustained growth in HNWI wealth levels over the past year.

This new scenario also implies a profound shift in investment profiles. Bank of America’s 2024 study confirms that younger HNWIs are reshaping their portfolios with a more diversified, digital, and alternative mindset:
- Only 47 % of their portfolios are in traditional equities and bonds, compared to 74% for those over 44 years.
- 17% already invest in alternative assets—versus 5% in older generations—and 93% plan to increase that exposure.
- 49% own cryptocurrencies, and another 38% are interested in acquiring them, making crypto the second-largest growth opportunity after real estate.
- Physical gold also draws interest: 45% already hold it, and another 45% are considering adding it to their portfolio.
These figures reflect not just new preferences, but a structural transformation in wealth-building.
A new client, a new challenge for managers
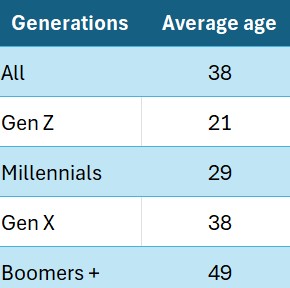
Northwestern Mutual’s 2024 Planning and Progress study, cited by the CFA Institute, shows that younger generations in the U.S. seek financial advisors at an earlier age. The average Baby Boomer began that relationship at age 49, Generation X at 38, and Millennials at just 29 (see Figure 1).
Figure 1: Age at which clients begin working with a financial advisor

Source: Northwestern Mutual Planning and Progress Study 2024
The great wealth transfer demands new strategies
The imminent generational wealth transfer represents an unprecedented opportunity—but also a significant threat for traditional managers. Over 80% of next‑generation HNWIs say they would change firms within the first two years after inheriting if their values and expectations aren’t met.
Each HNWI generation has specific needs. Faced with this structural shift, managers must deeply review their engagement strategies, products, and services to effectively meet more sophisticated and segmented demand.

Additionally, young investors state that they prioritize products with environmental or social impact, while others lean towards digital and customizable solutions. This presents a dual challenge for emerging managers: meeting sophisticated expectations and building portfolios combining performance, purpose, and transparency.
In this context, new advisors must focus on building relationships and offering personalized, results-oriented services—understanding and delivering what new investors genuinely value and are willing to pay for.
This new approach implies rethinking the perception of financial advice to emphasize a connection-based approach, which will help attract younger investors.
Securitization: From technical instrument to enabling strategy
Securitization allows transforming liquid or illiquid assets into tradeable financial instruments. Traditionally used by banks or large managers to package mortgages, loans, or income streams, specialized platforms like FlexFunds are democratizing its use—enabling independent or boutique managers access to this financial engineering with greater agility.
“Securitization can be a pathway for asset managers and investment advisors to create customized investment vehicles that allow them to repackage investment strategies, and enhance global distribution by facilitating capital raising on international banking platforms—all without requiring costly structures or complex infrastructure,” says Emilio Veiga Gil, executive vice president of FlexFunds.
This flexible packaging capability allows managers to:
- Convert personalized strategies into listed securities (ETPs).
- Include alternative assets in structures tailored to different risk profiles.
- Align investment vehicle time horizons with young clients’ goals.
Democratization and scalability
Securitization also supports scalability, a critical factor for new managers. Many operate from agile, non‑bank structures and seek efficient solutions to enter new markets. By using investment vehicles, they can scale distribution without sacrificing personalization.
According to the II Annual Report of the Securitization Sector 2024–2025 by FlexFunds and Funds Society, 56% of advisors surveyed have managed an investment vehicle—demonstrating solid expertise in the field—while 40% have yet to use this tool, highlighting a growth opportunity.
Transparency, traceability and trust
Another key advantage is the traceability provided by investment vehicles. In an environment where young people value transparency, audited structures with validated periodic information become a reputational asset.
New generations have more access to information—and greater skepticism. Offering products with clear structures and transparent return flows builds trust and loyalty.
Today, next generation HWNI seek investments aligned with their values (sustainability, technology, social impact). Through securitization, asset managers can repackage alternative assets—such as renewable energy, green loans, or digital assets—into accessible listed securities, meeting new investor preferences within the regulatory framework.
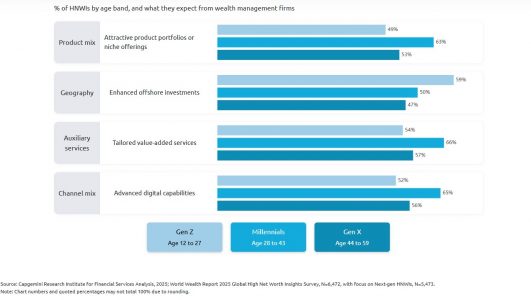
To adapt to this new client profile, managers should prioritize:
- Customized, diversified investment portfolios
- Promoting geographic diversification through offshore solutions
- Developing value‑added services focused on wealth and tax planning
- Implementing personalized concierge services; next‑generation HNWIs expect services beyond finance: health, education, cybersecurity, travel, etc.
- Bridging the digital gap and modernizing communication channels
- Educating heirs and strengthening their connection to the firm
A more open future, if managed with vision
The key for securitization to become a competitive advantage lies in its strategic use. It’s not just about bundling assets, but rethinking how these products can broaden access, enhance young investors’ experience, and build sustainable business models.
Mass personalization and digital integration will be key differentiators. Managers who can combine financial engineering with purpose and digital intelligence will have the edge in winning young clients.
Asset securitization has ceased to be an exclusive instrument for large institutional players—it is transforming into an enabler of innovation, scalability, and trust for the new generation of managers. In a context where young investors seek advice earlier and with higher expectations, this tool can bridge structural sophistication with the ease of use demanded by the future of asset management.
