How Asset Managers Will Turn the Global Wealth Boom Into Business
| By Amaya Uriarte | 0 Comentarios

Although the asset management industry is undergoing a clear process of transformation and consolidation—leading to fewer players in the market—the reality is that business opportunities remain strong. According to estimates from the latest report by Morgan Stanley and Oliver Wyman, global household financial wealth is on track to reach 393 trillion U.S. dollars by 2029, with a compound annual growth rate of 5.5%. In other words, individuals will continue to need investment products.
In fact, global household financial wealth reached 301 trillion U.S. dollars in 2024, marking a 7% increase in 2023 and an 8% rise in 2024. Its growth was resilient across all regions, with the Americas and the Middle East & Africa showing the largest gains, excluding currency effects. However, when adjusted for currency, real growth in U.S. dollars was moderate across all regions, with negative growth in Latin America and Japan.
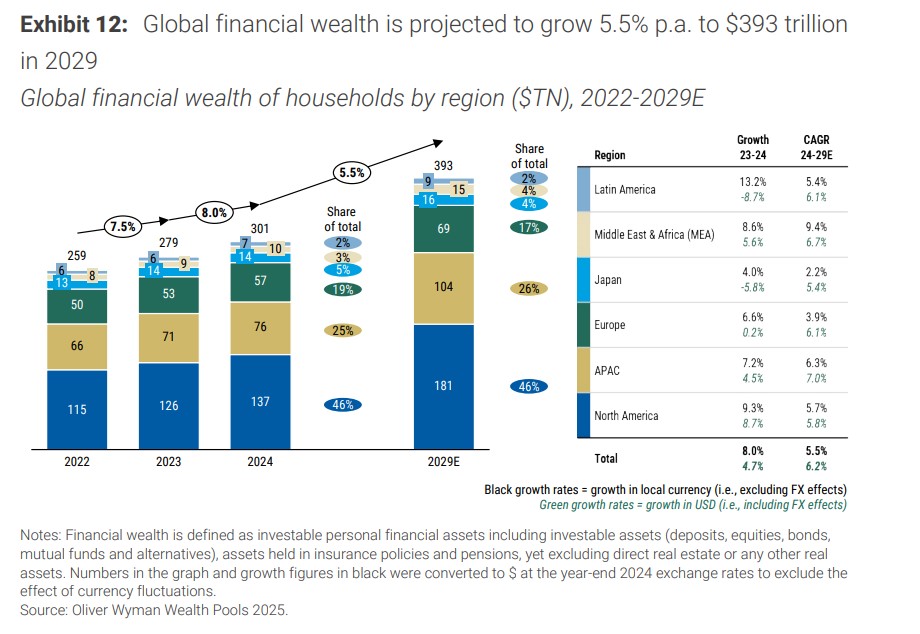
Looking ahead, the report projects that global financial wealth will grow at an annual rate of 5.5% through 2029, returning to a level closer to the 6% annual rate observed between 2019 and 2023. In absolute terms, wealth growth remains heavily concentrated in North America and APAC. Europe’s wealth could benefit from supportive policies and increased household investment allocation in the future. The Middle East and Africa, as well as Latin America, show steady growth. Overall, growth rates are lower than in previous reports due to the inclusion of life insurance, pensions, and the wealth bracket below 0.3 million dollars.
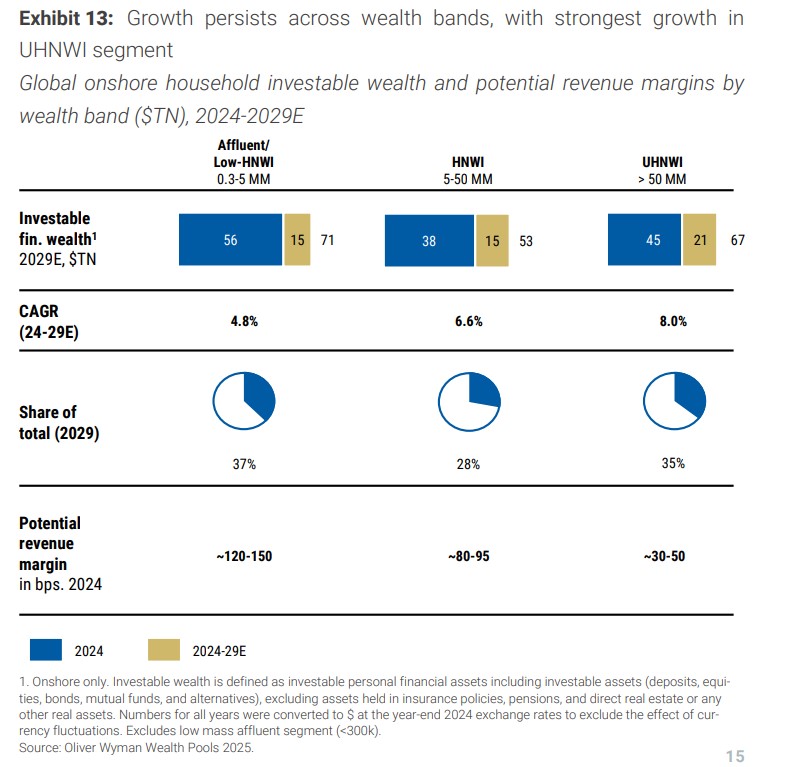
The analysis also shows that, in terms of onshore investable financial wealth—defined as financial wealth held onshore excluding assets in insurance policies and pensions—ultra-high-net-worth individuals (UHNWIs) and high-net-worth individuals (HNWIs) will continue to drive wealth creation with annual growth rates of 8.0% and 6.6%, respectively, over the next five years. However, the upper end of the Affluent/Lower-HNWI group remains a significant opportunity for asset managers globally: a segment that is “wealthy but underserved” and offers significantly higher revenue potential than the UHNWI and HNWI space. Asset managers that can tailor their offerings and manage costs can unlock growth in this segment.
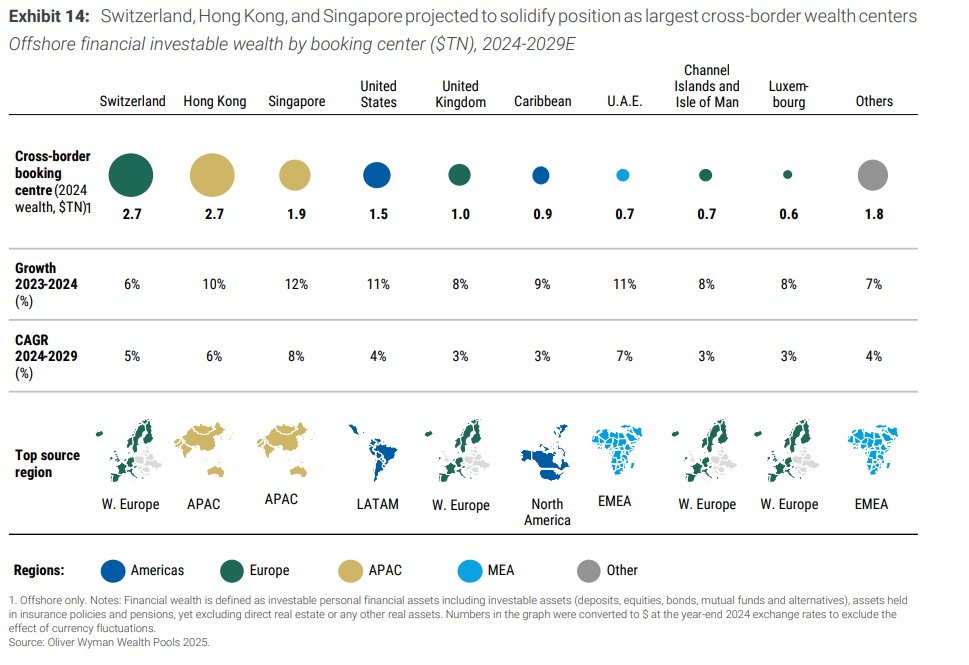
Offshore financial wealth totaled 14 trillion U.S. dollars in 2024, with cross-border wealth flows growing at nearly 10% annually, outpacing global growth. Geopolitical uncertainty and diversification needs among UHNWI clients are sustaining demand for booking centers in safe havens. The three largest cross-border wealth hubs—Switzerland, Hong Kong, and Singapore—are expected to capture nearly two-thirds of new inflows through 2029. Outside these top centers, the United States and the United Arab Emirates are projected to see the fastest growth, with the U.S. benefiting from Latin American flows and the UAE expanding its appeal beyond the Middle East.
In terms of converting clients into profit, the challenge for asset managers will be to tap into this expanding pool while managing costs effectively. The report highlights that revenue margins in the sector dropped by 6 basis points in 2024 and another 3 basis points in the first half of 2025. Three out of four leading firms recorded declines, and only half offset them through cost reductions—further highlighting pressure on margins.
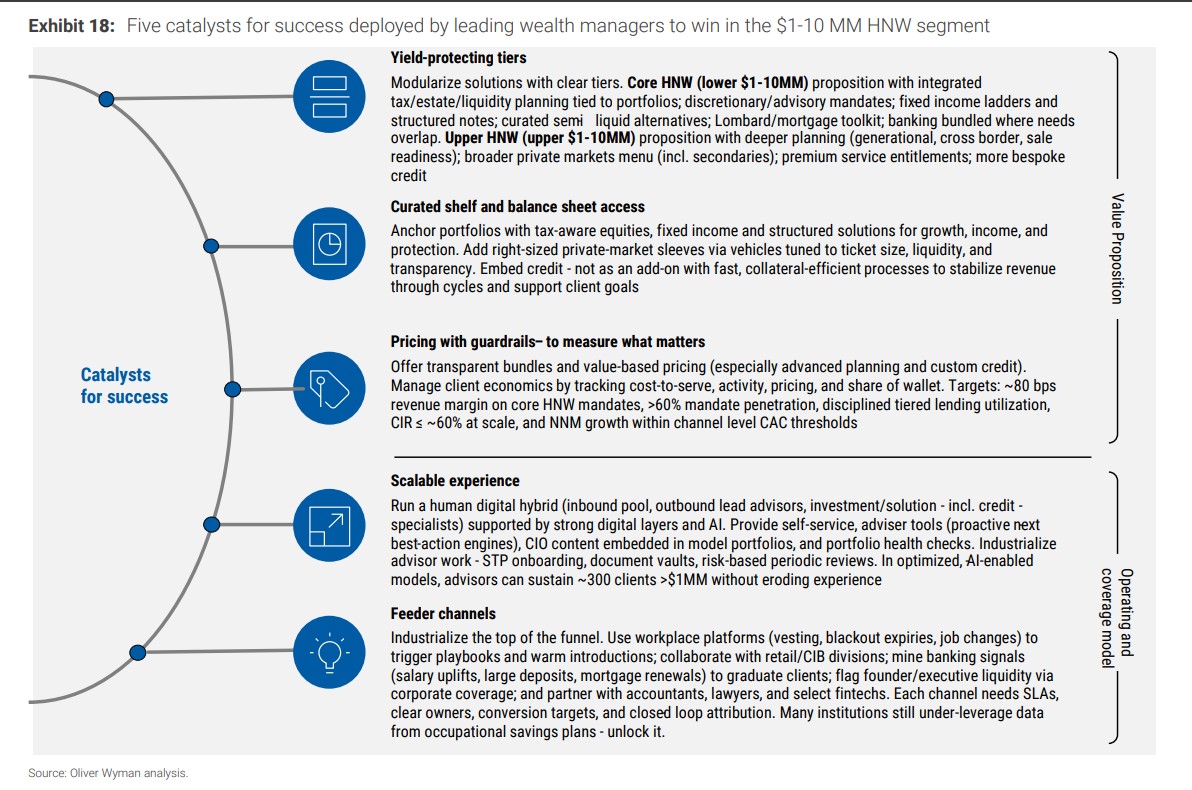
Clients with a net worth between 1 and 10 million U.S. dollars are identified as a key segment. This group is the largest by volume, offers higher basis-point returns than UHNWIs, and is seeing the entry of many new participants who are unadvised and holding substantial cash reserves. To win in this segment, leading asset managers are mobilizing five strategic catalysts:
Modular investment solutions with varying levels of performance protection.
Portfolio anchoring with tax-efficient equities, fixed income, and structured solutions for growth, income, and protection.
Transparent packaging and value-based pricing.
A hybrid human-digital model supported by robust digital and AI layers.
Enhanced client acquisition channels.
At the same time, asset managers are being warned against over-reliance on market beta. Between 2015 and 2024, only about one-third of asset manager growth came from net new money, prompting firms to focus more on relationship manager productivity, pricing discipline, and increasing wallet share from existing clients.
Morgan Stanley and Oliver Wyman emphasize that asset managers must urgently readjust their costs: “Many cost-to-income ratios (CIRs) hover around 75%, with personnel accounting for around two-thirds of operating expenses. Operating model programs can unlock between 10% and 25% in gross savings before reinvestment.”


