UBS Hires Diego Pivoz in Switzerland to Cover Saudi Arabia’s UHNW Segment
| By Marcelo Soba | 0 Comentarios

| By Marcelo Soba | 0 Comentarios
| By Marcelo Soba | 0 Comentarios

Apollo Global Management has appointed Laura González as Managing Director of its global wealth business for US Offshore and Latin America, sources at the firm confirmed to Funds Society.
González, currently Head of Allfunds for the Americas (U.S. and LatAm), will take on her new role in May. With over 13 years at Allfunds, she initially oversaw Iberia and Latin America before being promoted to Head of the Americas in 2022, according to her LinkedIn profile.
Apollo, a firm specializing in alternative investments, has set “ambitious goals” of reaching $150 billion by 2029, a target announced during its Investor Day in October 2024.
For Apollo, González is a seasoned professional who will play a crucial role in expanding the firm’s ability to serve these markets.
“Expanding our Global Wealth business is a key priority for Apollo as we respond to growing investor demand for private market solutions that offer greater diversification beyond the traditional 60/40 portfolio model. We are committed to providing institutional-quality offerings tailored to the distinct needs of individual and wealth investors,” said Stephanie Drescher, Partner and Chief Client & Product Development Officer at Apollo, in a statement accessed by Funds Society.
Apollo’s Global Wealth unit aims to deliver a comprehensive range of alternative investment solutions across asset classes such as credit, equity, and real assets, structured in ways that prioritize the needs of end investors, the firm added.
| By Marcelo Soba | 0 Comentarios
Alejandro Rubinstein has joined Insigneo as Senior Vice President. Based in the Brickell office in Miami, he will focus on providing advisory and brokerage services to clients in the United States, Chile, Colombia, and Peru, according to a statement issued by Insigneo,.
Rubinstein, who brings more than 25 years of experience in international markets, comes from Merrill Lynch. His expertise in global financial services and focus on customized solutions for clients aligns with the company’s strategy, the press release said.
“I’m excited to be part of Insigneo’s innovative culture, where expertise and creativity combine to deliver outstanding client experiences,” said Rubinstein.
As Senior Vice President, he will leverage Insigneo’s platform of resources and services to expand his business and develop financial strategies tailored to his clients’ needs, the firm adds.
“We are pleased to have Alex join the Insigneo team,” said Jose Salazar, Market Head of Miami. “His experience in international markets complements our robust platform of services and resources. We look forward to growing together and developing his business.”
| By Amaya Uriarte | 0 Comentarios

Citi will lose its Global Head of Private Banking, Ida Liu, as the executive announced in a LinkedIn post.
“After nearly two decades at Citi, including the privilege of serving as Global Head of Citi Private Bank, I have made the decision to leave the firm and embark on the next chapter of my professional journey,” Liu posted on LinkedIn.
The expert, with more than 25 years of experience, joined Citi in 2007, where she held various positions until her most recent role as Global Head of Private Banking, according to her LinkedIn profile.
“Great careers are defined by embracing new challenges and opportunities, and this is the right time to leverage my global experience, leadership expertise, and passion for growth in bold and exciting new ways,” added the executive of the U.S. bank.
In addition to Citi, Liu worked at Merrill Lynch (1999-2004) and Vivienne Tam (2004-2007).
| By Amaya Uriarte | 0 Comentarios

| By Amaya Uriarte | 0 Comentarios

The week has begun with the tech sector reeling. On Monday, Nvidia led a market slump—dropping as much as 17%—triggered by the strong performance of the low-cost generative AI assistant developed by Chinese company DeepSeek. According to experts, the emergence of a potentially more efficient approach to AI processing—reducing model training costs by 86%—raises questions about the necessity of the billions of dollars planned for infrastructure and intellectual property investment.
As a result, the S&P 500 index dropped 1.5%, and Nvidia‘s decline—the largest single-day market capitalization loss for the company at $589 billion—dragged the Nasdaq Composite down 3.1%. “The emergence of the new competitor has primarily impacted the entire data center value chain. This includes chip manufacturing equipment makers like ASML (-7.2%), high-performance chip manufacturers (Nvidia and Broadcom (-17.4%)), as well as companies specializing in energy infrastructure like Schneider Electric (-9.6%) or the real estate side of data centers like Digital Realty (-8.7%),” explain analysts at Banca March.
What explains these movements? In recent days, the generative AI assistant developed by DeepSeek has become the most downloaded app for iPhone, surpassing the popular ChatGPT application from OpenAI. Nvidia‘s drop has been the most visible consequence of this shift, driven by fears about the impact DeepSeek could have on the demand for high-end microchips.
“DeepSeek could be a seismic shift for the AI industry. If its advancements hold true, model training costs would drastically decrease, changing the game for everyone,” says Víctor Alvargonzález, founder of Nextep Finance. In his view, one of the main reasons behind Wall Street’s recent sell-off—particularly Nvidia‘s worst-ever trading session in U.S. stock market history—is DeepSeek‘s promise to reduce algorithm training costs. Estimates suggest that training costs could drop from the current $50 million per model to just $7 million or less, thanks to process simplification and a 75% reduction in memory requirements.
Amid these declines, Louise Dudley, portfolio manager of global equities at Federated Hermes Limited, believes there are still many questions left unanswered. “For Nvidia, as a key supplier of premium chips worldwide, the concern is whether companies will need fewer chips in the future. However, the company responded to the news by highlighting ‘excellent progress,’ signaling optimism about ongoing AI model developments, which are still in their relative infancy.
For companies involved in building data centers, the short-term impact is likely to be significant, as demand has been very strong. The new DeepSeek model code will be reviewed for potential performance improvements. Existing projects under development are at risk, and this will be a key focus for investors. This news will likely increase both corporate and consumer appetite for AI tools, given improved accessibility, leveraging this innovation and accelerating AI adoption timelines,” Dudley points out.
Market Reactions and Expert Insights
According to Hyunho Sohn, portfolio manager of the Fidelity Funds Global Technology Fund, Chinese AI startup DeepSeek has introduced AI models that perform comparably to OpenAI’s ChatGPT models while being significantly more cost-effective. “This efficiency advantage has raised a series of questions about the perceived ‘winners’ in the global AI ecosystem, the implications for hyperscaler capital expenditures, and the effectiveness of sanctions and export bans aimed at preventing high-level generative AI progress in China.
This is an evolving situation, and we may see short-term volatility until it becomes clear how much more efficient this technology really is. While broader implications must be assessed on a case-by-case basis, I generally believe this development will be deflationary,” Sohn states.
Despite the shockwaves, Fidelity’s portfolio manager believes this is ultimately beneficial for end-users and service providers, though it could have negative implications for hardware. “This is similar to what we saw in the early days of the internet when people vastly underestimated the scale of innovation, technological adoption, and service-based business potential, while greatly overestimating the total addressable market (TAM) for hardware,” explains Sohn.
In the view of Amadeo Alentorn, manager of the Global Equity Absolute Return fund and head of the systematic equity team at Jupiter AM, DeepSeek’s rise is part of a broader trend that has been developing for months. In recent times, there have been major advances in Small Language Models (SLM), which contrast with the large models used by companies like OpenAI. The central question has been whether it is possible to build more precise, specialized models that focus on specific areas, such as law or medicine, rather than encompassing all knowledge.
“So far, the rise of artificial intelligence has primarily benefited a small group of large companies. However, recent advancements suggest that we may be witnessing a paradigm shift, where smaller companies can also leverage this technology without needing massive infrastructure investments. Identifying which companies will lead this new AI phase is a complex task, but what is clear is that this evolution promotes diversification within the sector. AI could expand beyond tech giants and create new business opportunities across various industries,” Alentorn asserts.
High Valuations Under Scrutiny
In this context, Fidelity’s portfolio manager acknowledges that, as he has been saying for some time, many AI semiconductors are expensive, with sentiment, valuations, and momentum slowing down—“the most interesting opportunities lie within the services ecosystem.”
“It’s still early, but I would add that the rapid developments in generative AI highlight the need for proximity and connection throughout the tech ecosystem—something we are well-positioned for, given the breadth and depth of our research coverage,” Sohn adds.
For Oliver Blackbourn, portfolio manager in the Multi-Asset team at Janus Henderson, AI has long been considered a highly complex area of development, with industry leaders perceived as having technological advantages that would allow them to maintain rapid growth. In his view, the expectation of high earnings growth has been used to justify elevated valuations, making these stocks highly vulnerable to any disappointment.
“Competition always seemed like the biggest threat, but also the hardest to assess for investors. The market’s reaction to a perceived radical shift in the competitive landscape has been fierce. Before U.S. markets opened today, Nasdaq 100 futures had fallen 3.9%, and ASML—one of Europe’s companies most exposed to the AI theme—had dropped more than 10%,” Blackbourn notes.
In his opinion, while it is easy to get ahead of events, it is also important to remember that high expectations have driven up valuations across the U.S. stock market and, consequently, global equities. “If we start to see U.S. stock valuations drop significantly, there is a risk that this will spill over into other high-valuation areas in Europe and Asia.
Similarly, with U.S. consumers more exposed than ever to the stock market, there is a broader risk of negative feedback loops if consumer confidence is shaken. A significant tightening of financial conditions due to stock market losses could quickly change the Federal Reserve’s outlook,” Blackbourn concludes.
| By Romina López | 0 Comentarios

Is your strategy prepared for the transformations redefining asset management in 2025? Technological integration, personalization, and the reinvention of operational models are reshaping the industry. Among these trends, asset securitization stands out as an innovative solution to maximize the growth of assets under management (AUM) and respond nimbly to increasing market complexity.
In this article, FlexFunds analyzes the significant trends shaping the future of asset management and how securitization can become a key strategic tool.
Investors no longer seek generic products; they now demand solutions tailored to their objectives, values, and circumstances. By 2025, digitalization, powered by advanced artificial intelligence (AI) tools, will enable asset managers to build portfolios aligned with specific risk tolerances and unique goals. Personalization is becoming the key differentiator in a saturated market.
The pandemic accelerated the shift toward digital financial services, and by 2025, hybrid asset management will become the norm. Technological platforms that combine the convenience of digital self-service with human advisory will allow firms to adapt to an increasingly competitive market.
The rise of automated advisors and investment platforms has driven down fees, forcing traditional portfolio managers to justify their value. Many are adopting alternative pricing models, such as subscriptions or fees based on service complexity.
As the massive wealth transfer from baby boomers to younger generations unfolds, asset managers face the challenge of maintaining multi-generational relationships. Technological tools simplify this transition by offering attractive investment options tailored to diverse generational profiles—from millennials interested in ESG to traditional investors.
AI is revolutionizing asset management, from portfolio structuring to client interaction. Its most notable applications include:
In the second Asset Securitization Industry Report by FlexFunds and Funds Society, surveying over 100 senior executives from Latin America, the U.S., and Spain, 82% of portfolio managers stated that AI could enhance their investment decision-making process.
Securitization as a strategic tool
Asset securitization is a vital tool for portfolio managers looking to adapt to these trends. It allows them to offer clients personalized investment strategies tailored to risk profiles and time horizons that are cost-efficient and agile compared to other market alternatives.
The benefits of asset securitization for portfolio managers include:
Asset management in 2025 will be defined by the ability to integrate technology, personalization, and innovative strategies like securitization. Managers who adopt a holistic approach, combining advanced digital tools with strong human relationships, will be best positioned to thrive in this evolving landscape.
To explore how FlexFunds can help you leverage securitization in your investment strategies, contact us at info@flexfunds.com.
| By Amaya Uriarte | 0 Comentarios

| By Amaya Uriarte | 0 Comentarios

| By Amaya Uriarte | 0 Comentarios

The world is experiencing a new environment marked by a cycle of interest rate cuts by the major central banks in developed markets, as well as in emerging regions. According to experts, over the past quarter, most monetary institutions have adopted a more cautious stance.
The best example of this is the Fed, which has once again shifted its focus to inflation, as economic activity has remained strong while disinflation has stalled. “The Fed maintains its data-dependent approach and is beginning to shift its attention to the labor market. We believe labor market conditions could shape the path of its future policy decisions. Similarly, the Bank of England and the European Central Bank also cut interest rates by 25 basis points in the third quarter of 2024, emphasizing data dependency without precommitting to any specific interest rate trajectory,” explain experts from Capital Group.
According to Invesco in its outlook for this year, rates remain generally restrictive in major economies but are easing. “On the one hand, the Fed is likely to remain neutral by the end of 2025, but improved growth prospects may delay rate cuts. On the other hand, European central banks are easing their policies, with relatively weaker growth than the U.S.,” they note.
Divergences in Monetary Policy
This reality brings us to a key conclusion: yes, we are in a cycle of rate cuts, but there will be noticeable divergences in the monetary policies of the major central banks. In fact, Capital Group believes that this divergence will play a significant role in the coming months.
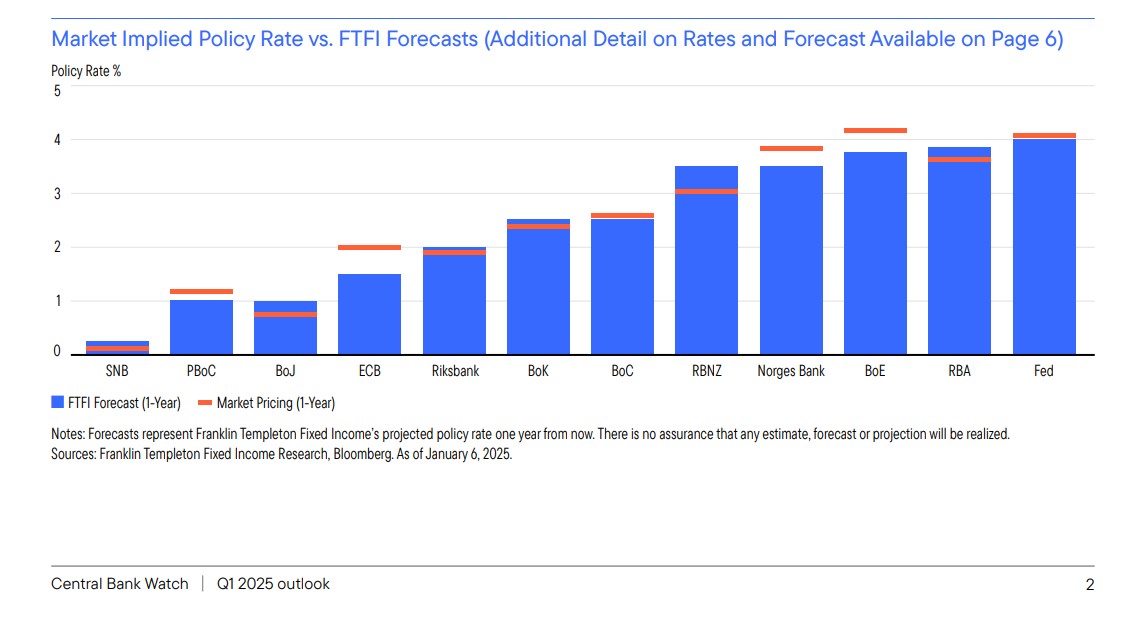
This is reflected in the Central Bank Watch report, prepared by Franklin Templeton, which reviews the activity of G10 central banks, plus two additional countries (China and South Korea), along with their forecasts.