The Indexed “American Dream”: How Trump Accounts Aim to Turn Childhood Savings Into Real Wealth
| By Marta Rodriguez | 0 Comentarios

The U.S. Department of the Treasury appointed BNY as the financial custodian for the Trump Accounts program on April 6, 2026, tasking the firm with managing the initiative’s national infrastructure. The program, BNY CEO Robin Vince explained, is based on a clear diagnosis: “Forty percent of Americans have no participation in the stock market. And in the world we live in, that’s a problem, because it means 40% of Americans have no connection to the country, to the capital markets, or to our capitalist system,” he said during the INSITE 2026 Summit.
The policy response, he added, is as simple as it is ambitious: “The idea is to give every American, from an early age, a stake in the capital markets, in the stock market, and the opportunity to build wealth and become part of the American Dream.”
The initiative has received support from both sides of the political spectrum as well as from Silicon Valley, where the concept originated. The Trump Accounts were created under the One Big Beautiful Bill Act and are structured as investment accounts for individuals under the age of 18.

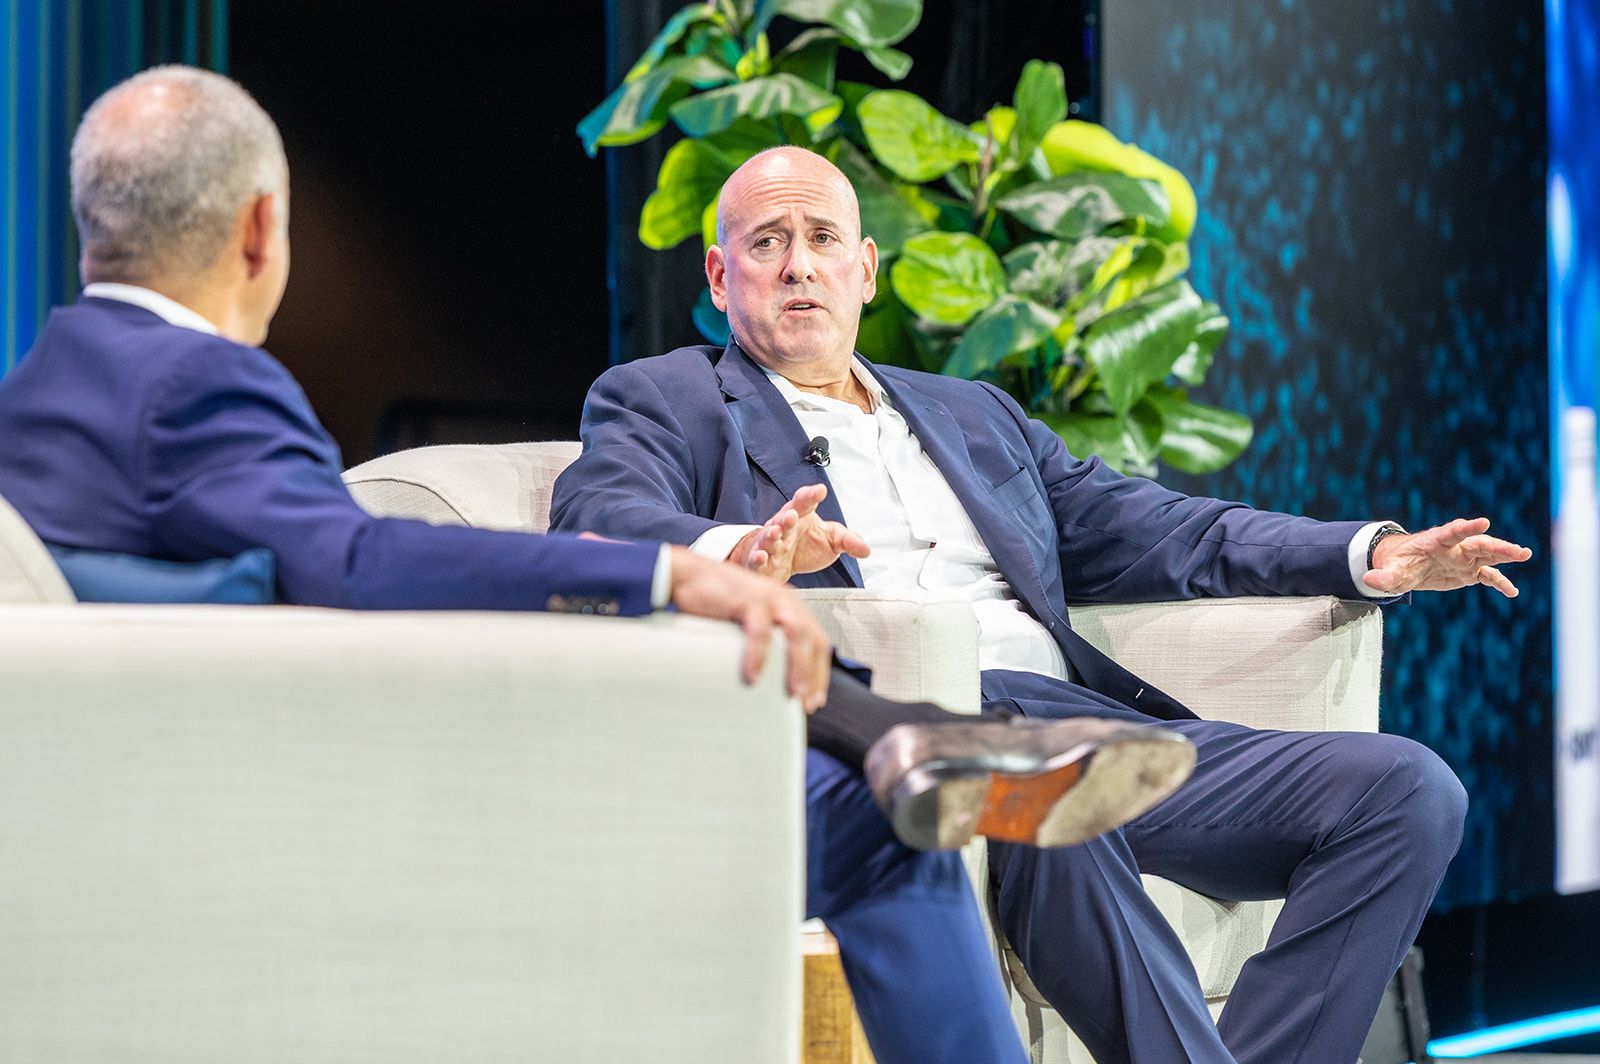
Robert Vince, CEO of BNY
Who can open an account and how
All individuals under the age of 18 with a valid Social Security number are eligible to hold a Trump Account. Children born between January 1, 2025, and December 31, 2028, qualify for the federal government’s initial $1,000 contribution. Those born outside that window may also open an account, but without the seed contribution. Enrollment is available through TrumpAccounts.gov or by submitting IRS Form 4547. According to the program, accounts will begin accepting contributions on July 4, 2026.
Families and third parties may contribute up to $5,000 annually. Employers may contribute up to $2,500 per year within that same overall limit. BNY has also committed to matching the federal contribution for all employees with children, Vince said. Nvidia, Goldman Sachs, and Uber, among other companies, have likewise pledged to match the Treasury’s initial contribution for their employees’ children.
How the money is invested and what happens at age 18
The default investment is a broad U.S. equity ETF tracking the S&P 500, with management fees capped at 0.10% per year. During the accumulation phase, investments are limited exclusively to index funds or ETFs tracking broad U.S. equity indices. Cash holdings, money market funds, leverage, and investments outside broad U.S. equity indexes are not permitted.
The funds remain inaccessible until the beneficiary turns 18, at which point the account is automatically converted into a Traditional IRA (Individual Retirement Account). From then on, the standard IRA rules apply: withdrawals made before age 59½ are taxed as ordinary income and may be subject to a 10% early withdrawal penalty.
According to Vince, the program’s real strength lies in its long-term investment horizon. He illustrated the concept with a compound growth example: “If you put that money into the account and invest it in an index fund, and you assume the same returns the U.S. stock market has delivered over the past 30 years, those $2,000 become $40,000 over 30 years.” He went further: “If that family sets aside just $10 a week during those same 30 years, the $40,000 becomes $140,000 by the time that child turns 30. That’s real wealth creation. That’s real participation in the American Dream.”
BNY and Robinhood: partners behind the infrastructure
As the program’s financial agent, BNY will manage the national infrastructure while partnering with brokerage platform Robinhood to provide the program’s initial brokerage and custody services. Together, the two firms will develop the program’s application, allowing families to easily access and manage their accounts.
The appointment reflects BNY’s existing role within the U.S. financial system. The bank already manages much of the government’s critical financial infrastructure, settling all U.S. Treasury auctions while the Federal Reserve’s open market operations rely on its technology.
“We provide critical services to the U.S. government. This was an opportunity to take our technology, our capabilities, and truly serve the United States through this public policy initiative,” Vince said.
To conclude, Vince issued a direct challenge to the firms attending INSITE 2026: “Whether you’re a company of five people, 500 people, or 5,000 people, are you in a position to match the contribution for each of your employees’ children?” For BNY, administering the program is also a statement of purpose. “We’re incredibly proud to play this role as America’s bank,” he said.