Foto cedidaPIMCO, miembro del Consejo Asesor Global de PIMCO.. PIMCO incorpora a Michèle Flournoy a su Consejo Asesor Global
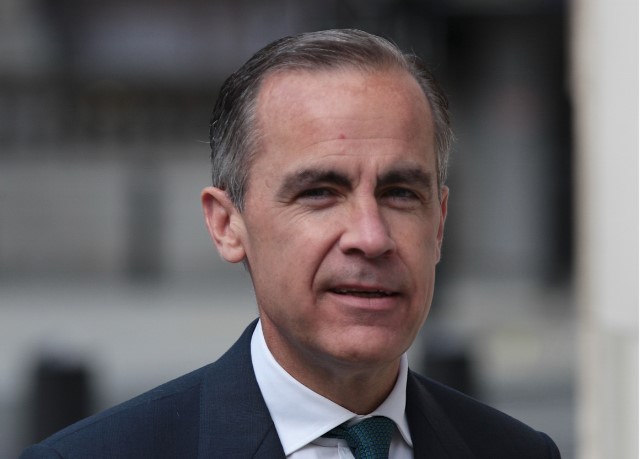
PIMCO announced in a press release that Mark Carney, economist and former Governor of both the Bank of England and the Bank of Canada, will join its Global Advisory Board. The Board provides PIMCO investment professionals with insights on global economic, political, and strategic developments and their relevance for financial markets.
Established over four years ago, it is “an important part of the firm’s investment process and is designed to provide a deeper understanding of the policies and institutions that influence financial markets”, says the document. Former Federal Reserve Chairman Ben Bernanke is the Chair of the Board, which is comprised of seven members including Carney.
“Mark’s extensive experience as an economist and central banker, combined with his focus on transforming climate finance, makes him an invaluable addition to this renowned group of thinkers,” said Emmanuel Roman, PIMCO’s Chief Executive Officer.
Meanwhile, Dan Ivascyn, Group Chief Investment Officer, pointed out that the Board “continues to be an important part of our investment process, providing unique global insight, and challenging our bias and assumptions, as we pursue the best investment outcomes for our clients around the world”.
Carney is currently UNSpecial Envoy on Climate Action and Finance. From 2013 to March 2020, he served as the Governor of the Bank of England and Chair of the Monetary Policy Committee, Financial Policy Committee and the Board of the Prudential Regulation Committee. In addition, he served as Chair of the Financial Stability Board (FSB) from 2011 to 2018, and First Vice-Chair of the European Systemic Risk Board. He was Governor of the Bank of Canada from 2008 to 2013.
Other members of the PIMCO Global Advisory Board are Gordon Brown, former U.K. Prime Minister and former Chancellor of the Exchequer; Ng Kok Song, former CIO of the Government of Singapore Investment Corporation (GIC); Anne-Marie Slaughter, former Director of Policy Planning for the U.S. State Department; Joshua Bolten, former White House Chief of Staff; and Jean-Claude Trichet, former President of the European Central Bank.
Foto cedida. UBS WM nombra a Anja Heuby-Egli responsable del área de soluciones de inversión sostenible
UBS Wealth Management has appointed Anja Heuby-Egli to lead a newly-created sustainable investment solutions function, reported Citywire Selector. She will be responsible for sustainable investing solutions at global wealth management, including general advisory, discretionary and advisory mandates, funds and alternatives.
According to an internal memo referred to by the publication, Heuby-Egli will join UBS chief investment office’s global mandates and investment content team (CIO GMIC) and will report directly to its head, Bruno Marxer. She will also become a member of the unit’s management committee.
Within global wealth management, her role only covers the CIO’s global mandates and investment content function. Andrew Lee will remain head of sustainable and impact investing for its other investment functions, which are known internally as the CIO investment office (IO), informed Citywire Selector. That unit is responsible for investment frameworks, for example asset allocation, methodologies and associated research and thought leadership.
Meanwhile, global mandates and investment content team is in charge of investment products, including those implementing investment views of the IO. When it comes to the 100% sustainable portfolios, Lee will continue to oversee the portfolio framework and methodology and any thought leadership associated with that.
Heuby-Egli’s team will work on the implementation of that framework in products, in collaboration with other content teams. Her primary focus will be EMEA, APAC, and Switzerland, and she will also collaborate with the Americas sustainable investing solutions team.
Experience in sustainable investment
Heuby-Egli started at UBS in 2005 and has worked in the investment bank, group functions, and global wealth management, primarily in the area of risk and investment process methodology. She was in charge of CIO’s data innovation and also worked with the CIO sustainable investment team, where she and her team developed the proprietary ESG scoring platform at the core of the firm’s personalised sustainable investment advice offering. Her new role will be covering wealth management activities, opposite to those of the whole UBS group.
Pixabay CC0 Public Domain. Santander CIB launches ESG Solutions global team headed by Steffen Kram
Santander Corporate & Investment Banking (Santander CIB) announced in a press release the creation of a dedicated team to boost its offering in the area of Environmental, Social and Governance (ESG) solutions. This new global team will be headed by Steffen Kram. It will partner with product teams across its platform to support clients in their transition towards a more sustainable business model by providing strategic solutions as well as product and financing structures tailored to specific industries, geographies and market sectors.
Santander’s goal is to build a more responsible bank and has made a number of commitments to support this objective including raising over 120 billion euros in green finance between 2019 and 2025. This figure will increase to 220 billion euros in 2030 and includes the Group´s overall contribution to green finance: project finance, syndicated loans, green bonds, capital and export finance, advisory and other products.
In the most recent Dow Jones Sustainability Index Santander achieved the highest ranking among all banks.
José M. Linares, SEVP and Global Head of Santander CIB, said that the creation of this team further reinforces their contribution to the group’s responsible banking commitments to support inclusive and sustainable growth. “We want to back our clients in their ESG transformation journey, helping them define and achieve their global sustainability objectives”, he added.
Kram, new Global Head of ESG Solutions, commented this new team will build on Santander’s global footprint and its commitment to climate and environmental sustainability. “We are a global leader in renewable energy financing and advisory. Our aim is to expand and transfer this expertise into other sectors and technologies crucial in the context of the energy transition”, he pointed out.
Leveraging on a solid track record in renewables and strong product capabilities across its platform, Santander CIB is now evolving towards fully integrated ESG solutions, serving an increasing appetite and demand from corporate and institutional clients. Being a leader in the area of sustainability has been a long-standing ambition for Santander CIB.
U.S. equities scored the best August since 1986 while setting a record high on Tuesday the 18th that made the thirty-three day coronavirus bear market of 2020, a 34% decline from February 19 – March 23, the shortest in market history. The new bull market is being fuelled by record fiscal and monetary stimulus, economic recovery and vaccine hopes and has rallied over 50% from the March low. What remains to be seen is if continued U.S. growth will suffice to end the current recession as one the sharpest and shortest on record as well.
In the fiscal cliff political arena, stimulus negotiations remain deadlocked with the Democrats recent rejection of the current $1.3 trillion Republican proposal. At month end, Evercore ISI’s economist Ed Hyman wrote in ‘Global V-Shaped Recovery’: Looking ahead, there are a number of factors that will lift US growth, eg, the surge in Consumer Net Worth, inventory rebuilding, the surge in vehicle production, the housing boom, reopening’s, and unprecedented global stimulus. A vaccine is likely…The US economy is starting a new expansion…The safest bet now is for a 5-year expansion with a 100% rally in the S&P. He may be right and we hope he is, but there will be some speed bumps along the way.
Following a major two-year review, Fed Chair Powell spoke at Jackson Hole on August 27th detailing the Fed’s conclusions for updating its monetary policy framework by moving to a flexible average inflation targeting (FAIT) approach.Bottom line: keep interest rates low to support a sustainable economic recovery. On August 19th, Barron’s financial writer Andrew Bary highlighted a G.research report on ViacomCBS (VIAC) by analyst John Tinker saying: ViacomCBS looks significantly undervalued based on the success of its streaming strategy and a potential sale of the company…Tinker’s view is that ViacomCBS is valued cheaply at just 6.5 times estimated 2020 earnings before interest, taxes, depreciation, and amortization (EBITDA). That compares with a price of 15 times Ebitda that Walt Disney (DIS) paid for Fox’s (FOXA) content assets in 2019 and a price of 13 times that AT&T (T) paid for Time Warner in 2018. Tinker’s ViacomCBS target equates to about eight times estimated 2021 EBITDA.
Since the March stock market low, value stocks, typically defined as cyclical or economically sensitive companies, have lagged growth stocks. We expect this to change as the economic recovery broadens and the value P/E discount narrows
Looking at the merger arb space, announced deals in July totaled $305 billion, a 60% increase from $189 billion in June, and essentially the same level of activity as July 2019. Sizeable M&A in July included Maxim Integrated’s acquisition by Analog Devices for $20 billion, Noble Energy’s acquisition by Chevron for $13 billion, and National General’s acquisition by Allstate Corp. for $4 billion.
Column by Gabelli Funds, written by Michael Gabelli
To access our proprietary value investment methodology, and dedicated merger arbitrage portfolio we offer the following UCITS Funds in each discipline:
GAMCO MERGER ARBITRAGE
GAMCO Merger Arbitrage UCITS Fund, launched in October 2011, is an open-end fund incorporated in Luxembourg and compliant with UCITS regulation. The team, dedicated strategy, and record dates back to 1985. The objective of the GAMCO Merger Arbitrage Fund is to achieve long-term capital growth by investing primarily in announced equity merger and acquisition transactions while maintaining a diversified portfolio. The Fund utilizes a highly specialized investment approach designed principally to profit from the successful completion of proposed mergers, takeovers, tender offers, leveraged buyouts and other types of corporate reorganizations. Analyzes and continuously monitors each pending transaction for potential risk, including: regulatory, terms, financing, and shareholder approval.
Merger investments are a highly liquid, non-market correlated, proven and consistent alternative to traditional fixed income and equity securities. Merger returns are dependent on deal spreads. Deal spreads are a function of time, deal risk premium, and interest rates. Returns are thus correlated to interest rate changes over the medium term and not the broader equity market. The prospect of rising rates would imply higher returns on mergers as spreads widen to compensate arbitrageurs. As bond markets decline (interest rates rise), merger returns should improve as capital allocation decisions adjust to the changes in the costs of capital.
Broad Market volatility can lead to widening of spreads in merger positions, coupled with our well-researched merger portfolios, offer the potential for enhanced IRRs through dynamic position sizing. Daily price volatility fluctuations coupled with less proprietary capital (the Volcker rule) in the U.S. have contributed to improving merger spreads and thus, overall returns. Thus our fund is well positioned as a cash substitute or fixed income alternative.
Our objectives are to compound and preserve wealth over time, while remaining non-correlated to the broad global markets. We created our first dedicated merger fund 32 years ago. Since then, our merger performance has grown client assets at an annualized rate of approximately 10.7% gross and 7.6% net since 1985. Today, we manage assets on behalf of institutional and high net worth clients globally in a variety of fund structures and mandates.
Class I USD – LU0687944552
Class I EUR – LU0687944396
Class A USD – LU0687943745
Class A EUR – LU0687943661
Class R USD – LU1453360825
Class R EUR – LU1453361476
GAMCO ALL CAP VALUE
The GAMCO All Cap Value UCITS Fund launched in May, 2015 utilizes Gabelli’s its proprietary PMV with a Catalyst™ investment methodology, which has been in place since 1977. The Fund seeks absolute returns through event driven value investing. Our methodology centers around fundamental, research-driven, value based investing with a focus on asset values, cash flows and identifiable catalysts to maximize returns independent of market direction. The fund draws on the experience of its global portfolio team and 35+ value research analysts.
GAMCO is an active, bottom-up, value investor, and seeks to achieve real capital appreciation (relative to inflation) over the long term regardless of market cycles. Our value-oriented stock selection process is based on the fundamental investment principles first articulated in 1934 by Graham and Dodd, the founders of modern security analysis, and further augmented by Mario Gabelli in 1977 with his introduction of the concepts of Private Market Value (PMV) with a Catalyst™ into equity analysis. PMV with a Catalyst™ is our unique research methodology that focuses on individual stock selection by identifying firms selling below intrinsic value with a reasonable probability of realizing their PMV’s which we define as the price a strategic or financial acquirer would be willing to pay for the entire enterprise. The fundamental valuation factors utilized to evaluate securities prior to inclusion/exclusion into the portfolio, our research driven approach views fundamental analysis as a three pronged approach: free cash flow (earnings before, interest, taxes, depreciation and amortization, or EBITDA, minus the capital expenditures necessary to grow/maintain the business); earnings per share trends; and private market value (PMV), which encompasses on and off balance sheet assets and liabilities. Our team arrives at a PMV valuation by a rigorous assessment of fundamentals from publicly available information and judgement gained from meeting management, covering all size companies globally and our comprehensive, accumulated knowledge of a variety of sectors. We then identify businesses for the portfolio possessing the proper margin of safety and research variables from our deep research universe.
Class I USD – LU1216601648
Class I EUR – LU1216601564
Class A USD – LU1216600913
Class A EUR – LU1216600673
Class R USD – LU1453359900
Class R EUR – LU1453360155
Disclaimer:
The information and any opinions have been obtained from or are based on sources believed to be reliable but accuracy cannot be guaranteed. No responsibility can be accepted for any consequential loss arising from the use of this information. The information is expressed at its date and is issued only to and directed only at those individuals who are permitted to receive such information in accordance with the applicable statutes. In some countries the distribution of this publication may be restricted. It is your responsibility to find out what those restrictions are and observe them.
Some of the statements in this presentation may contain or be based on forward looking statements, forecasts, estimates, projections, targets, or prognosis (“forward looking statements”), which reflect the manager’s current view of future events, economic developments and financial performance. Such forward looking statements are typically indicated by the use of words which express an estimate, expectation, belief, target or forecast. Such forward looking statements are based on an assessment of historical economic data, on the experience and current plans of the investment manager and/or certain advisors of the manager, and on the indicated sources. These forward looking statements contain no representation or warranty of whatever kind that such future events will occur or that they will occur as described herein, or that such results will be achieved by the fund or the investments of the fund, as the occurrence of these events and the results of the fund are subject to various risks and uncertainties. The actual portfolio, and thus results, of the fund may differ substantially from those assumed in the forward looking statements. The manager and its affiliates will not undertake to update or review the forward looking statements contained in this presentation, whether as result of new information or any future event or otherwise.
Foto cedida. Jean Hynes sucederá a Brendan Swords como consejero delegado de Wellington Management
Wellington Management has announced in a press release that Brendan Swords, Chief Executive Officer, will retire from Wellington on 30 June 2021. At that time, Jean Hynes, Managing Partner, will succeed him as CEO.
“One of the most enduring lessons of the Wellington partnership is the notion of stewardship, bringing along the next generation of leaders to allow us to better serve clients,” said Swords.
“I’m excited that Jean Hynes will be my successor. Over the course of her nearly 30 years at the firm, she has demonstrated the vision, optimism, and fortitude to lead Wellington in the years ahead. Her extensive investment and leadership experience align with our mission of delivering investment excellence to our clients”, he added.
Meanwhile, Hynes claimed to be “humbled and honored” to be the next CEO of Wellington Management. “I have had the privilege of learning alongside Brendan for many years, and I am looking forward to building on our long heritage of helping our clients and their beneficiaries around the world achieve their investment goals”, she said.
Hynes joined the firm in 1991 after graduating from Wellesley College with a BA in economics. Throughout her nearly 30 years at the firm, she has researched the pharmaceutical and biotechnology industries, as well as served as a healthcare portfolio manager and leader of this sector’s research team. Since 2014, she has served as one the firm’s three Managing Partners alongside Swords. Hynes is a member of the Investment Committees at Wellesley College and the Winsor School.
U.S. equities moved higher in July against the daunting backdrop of renewed Coronavirus surges that are raising risks for the nascent U.S. economic recovery. During the J.P. Morgan second quarter conference call, CEO Jamie Dimon said, “You’re going to have a much murkier economic environment going forward than you had in May and June, and you have to be prepared for that.” Investor confidence that monetary policy and another fiscal stimulus package will continue to backstop the U.S. economy and markets provides major support for stock prices.
GAMCO expects to see more mergers, some facilitated by SPACs (special-purpose acquisition companies), private equity, or corporations looking to grow. Amazon may decide buy a filmed-entertainment company to gain new content.The outlook for deals and financial engineering brightened during the Honeywell International earnings call when CEO Darius Adamczyk said, “the balance sheet is very strong and well-protected, well-funded. So in short, we’re very much open for business, both from an M&A perspective, as well as potential buyback perspective… the M&A environment is just a little bit slower just because everybody is focused on battling the crisis. But we think that that may open up a little bit more here in the second half, and we hope to be active.”
Among GAMCO’s Private Market Value (PMV) with a Catalyst™ stock research ideas highlighted as ‘stock picks’ during BARRON’S 2020 Midyear Roundtable, published in the July 13 issue, were: NextEra Energy Partners (NEP), which manages renewable-energy projects, Maple Leaf Foods (MFI), equipment rental supplier Herc Holdings (HRI), Vivendi (VIV), Sony (SNE) and GCP Applied Technologies (GCP), a specialty construction chemicals, building materials, and packaging sealants producer. Catalyst Starboard Value, an activist investor, recently won eight board seats.
The recent Coronavirus spike slowed the rally in value, small cap stocks, and the U.S. dollar as economic slowdown fears resurfaced. A weaker dollar will make the U.S more competitive in global trade.
Column by Gabelli Funds, written by Michael Gabelli
To access our proprietary value investment methodology, and dedicated merger arbitrage portfolio we offer the following UCITS Funds in each discipline:
GAMCO MERGER ARBITRAGE
GAMCO Merger Arbitrage UCITS Fund, launched in October 2011, is an open-end fund incorporated in Luxembourg and compliant with UCITS regulation. The team, dedicated strategy, and record dates back to 1985. The objective of the GAMCO Merger Arbitrage Fund is to achieve long-term capital growth by investing primarily in announced equity merger and acquisition transactions while maintaining a diversified portfolio. The Fund utilizes a highly specialized investment approach designed principally to profit from the successful completion of proposed mergers, takeovers, tender offers, leveraged buyouts and other types of corporate reorganizations. Analyzes and continuously monitors each pending transaction for potential risk, including: regulatory, terms, financing, and shareholder approval.
Merger investments are a highly liquid, non-market correlated, proven and consistent alternative to traditional fixed income and equity securities. Merger returns are dependent on deal spreads. Deal spreads are a function of time, deal risk premium, and interest rates. Returns are thus correlated to interest rate changes over the medium term and not the broader equity market. The prospect of rising rates would imply higher returns on mergers as spreads widen to compensate arbitrageurs. As bond markets decline (interest rates rise), merger returns should improve as capital allocation decisions adjust to the changes in the costs of capital.
Broad Market volatility can lead to widening of spreads in merger positions, coupled with our well-researched merger portfolios, offer the potential for enhanced IRRs through dynamic position sizing. Daily price volatility fluctuations coupled with less proprietary capital (the Volcker rule) in the U.S. have contributed to improving merger spreads and thus, overall returns. Thus our fund is well positioned as a cash substitute or fixed income alternative.
Our objectives are to compound and preserve wealth over time, while remaining non-correlated to the broad global markets. We created our first dedicated merger fund 32 years ago. Since then, our merger performance has grown client assets at an annualized rate of approximately 10.7% gross and 7.6% net since 1985. Today, we manage assets on behalf of institutional and high net worth clients globally in a variety of fund structures and mandates.
Class I USD – LU0687944552
Class I EUR – LU0687944396
Class A USD – LU0687943745
Class A EUR – LU0687943661
Class R USD – LU1453360825
Class R EUR – LU1453361476
GAMCO ALL CAP VALUE
The GAMCO All Cap Value UCITS Fund launched in May, 2015 utilizes Gabelli’s its proprietary PMV with a Catalyst™ investment methodology, which has been in place since 1977. The Fund seeks absolute returns through event driven value investing. Our methodology centers around fundamental, research-driven, value based investing with a focus on asset values, cash flows and identifiable catalysts to maximize returns independent of market direction. The fund draws on the experience of its global portfolio team and 35+ value research analysts.
GAMCO is an active, bottom-up, value investor, and seeks to achieve real capital appreciation (relative to inflation) over the long term regardless of market cycles. Our value-oriented stock selection process is based on the fundamental investment principles first articulated in 1934 by Graham and Dodd, the founders of modern security analysis, and further augmented by Mario Gabelli in 1977 with his introduction of the concepts of Private Market Value (PMV) with a Catalyst™ into equity analysis. PMV with a Catalyst™ is our unique research methodology that focuses on individual stock selection by identifying firms selling below intrinsic value with a reasonable probability of realizing their PMV’s which we define as the price a strategic or financial acquirer would be willing to pay for the entire enterprise. The fundamental valuation factors utilized to evaluate securities prior to inclusion/exclusion into the portfolio, our research driven approach views fundamental analysis as a three pronged approach: free cash flow (earnings before, interest, taxes, depreciation and amortization, or EBITDA, minus the capital expenditures necessary to grow/maintain the business); earnings per share trends; and private market value (PMV), which encompasses on and off balance sheet assets and liabilities. Our team arrives at a PMV valuation by a rigorous assessment of fundamentals from publicly available information and judgement gained from meeting management, covering all size companies globally and our comprehensive, accumulated knowledge of a variety of sectors. We then identify businesses for the portfolio possessing the proper margin of safety and research variables from our deep research universe.
Class I USD – LU1216601648
Class I EUR – LU1216601564
Class A USD – LU1216600913
Class A EUR – LU1216600673
Class R USD – LU1453359900
Class R EUR – LU1453360155
Disclaimer:
The information and any opinions have been obtained from or are based on sources believed to be reliable but accuracy cannot be guaranteed. No responsibility can be accepted for any consequential loss arising from the use of this information. The information is expressed at its date and is issued only to and directed only at those individuals who are permitted to receive such information in accordance with the applicable statutes. In some countries the distribution of this publication may be restricted. It is your responsibility to find out what those restrictions are and observe them.
Some of the statements in this presentation may contain or be based on forward looking statements, forecasts, estimates, projections, targets, or prognosis (“forward looking statements”), which reflect the manager’s current view of future events, economic developments and financial performance. Such forward looking statements are typically indicated by the use of words which express an estimate, expectation, belief, target or forecast. Such forward looking statements are based on an assessment of historical economic data, on the experience and current plans of the investment manager and/or certain advisors of the manager, and on the indicated sources. These forward looking statements contain no representation or warranty of whatever kind that such future events will occur or that they will occur as described herein, or that such results will be achieved by the fund or the investments of the fund, as the occurrence of these events and the results of the fund are subject to various risks and uncertainties. The actual portfolio, and thus results, of the fund may differ substantially from those assumed in the forward looking statements. The manager and its affiliates will not undertake to update or review the forward looking statements contained in this presentation, whether as result of new information or any future event or otherwise.
Foto cedidaAdrie Heinsbroek, Principle Responsible Investment at NN IP. La interacción entre gobiernos, empresas y particulares en el mundo post-COVID-19 determinará el futuro de la inversión responsable
COVID-19 has disrupted every aspect of human life. This global threat has spurred us to reconsider priorities and heightened the importance of social justice and preservation of the planet. But if it is to be the catalyst that drives change towards a more sustainable world, what role will governments, companies and individuals be required to play? In a press release, NN Investment Partners identified new “unknowns” that responsible investors will increasingly need to take into account in their decision-making.
“Fundamental changes are already underway, as seen in the unprecedented fiscal and financial packages from governments, issuance of social bonds to fund healthcare and employment preservation projects, and companies cancelling dividends and share buybacks to focus on the welfare of their employees and other stakeholders”, says the asset manager. In its view, a second theme to emerge has been the increased urgency to shift to a lower carbon world. “It is already clear that corporate adaptability and responsibility helps build this resilience from an investment performance perspective”.
Adrie Heinsbroek, Principle Responsible Investment at NN IP pointed out that how a new “social contract” between governments, companies and individuals might play out raises many questions. “Investors and asset managers must assess how they should act upon these unknowns and be aware of how flexible they need to be if they are to adapt and tap into these corona-led trends”, he commented.
On 15 July 2020, Heinsbroek was joined by Joseph Stiglitz, Nobel Laureate and former World Bank chief economist, in a digital event to discuss how the actions and interactions of governments, companies and individuals will shape responsible investing in a post-Covid-19 world. This was the second event in NN IP’s UpsideDown series focusing on the world after corona.
Stiglitz said that COVID-19 has created many shocks but it has also accelerated changes that were already underway, especially around how we value economic and commercial success. “GDP, for example, is too simplistic a measure and ultimately misleading. A broader set of indicators are needed to accurately capture the value inherent in wellbeing and sustainability in a new multi-stakeholder world”, he added.
The transition towards a more balanced and inclusive economy is both dependent on and steers developments for three key groups: governments, companies and individuals; “and they form a triangle that is not just linked but also mutually dependent”, says NN IP. Differences between countries, cultures, economic status and type of government will also affect the speed and direction of change.
How will governments lead?
A major question for the asset manager is how interventionist will governments be in the next decade. In its view, the fiscal and monetary support packages enacted to combat the economic fallout from the COVID-19 crisis are “unprecedented”.
But will these packages and government policy be linked to the sustainability agenda, such as climate-change measures and carbon-reduction initiatives? Will governments take this opportunity to make financial support for companies conditional on tackling issues such as social inclusion? Will they intervene more assertively, using punishment and incentives to steer corporate behaviour? “They will also need to collaborate more internationally to meet climate targets and other sustainability goals”, adds NN IP.
A multi-stakeholder model
NN IP believes that within the triangle, companies have the most opportunity to propel change towards a more sustainable economy. The unknowns at a corporate level are driven by the trade-off between a “shareholder first” approach and a multi-stakeholder model. The value of social behaviour (looking after customers and employees rather than investors via dividends or share buybacks) is one of the most prominent developments to have come out of the pandemic.
Will this more sustainable value creation at corporate level become a more permanent trend and continue to be rewarded in the post COVID-19 world? Will companies discard practices that put shareholder interests above those of other stakeholders? If a multi-stakeholder perspective becomes the driver for value creation, the firm expects non-financial parameters to become a determining factor in assessing and predicting this. “Such a change will also affect the role that environmental, social and governance (ESG) factors play in assessing financial value”.
Individuals behaviour
The COVID-19 crisis has increased people’s awareness of climate and social issues and the consequences of their behaviour. But will this heightened awareness translate into new patterns of behaviour? Will preferences strengthen for more sustainable products and services, such as organic foods? Will the trends developed during the lockdown, such as healthier lifestyles and less flying, continue? Finally, will sustainability become a privilege just for those who can afford it, posing a threat to a more inclusive global society?
Heinsbroek concludes: “There will be many challenges ahead and differences to address, but there are also elements that connects us. One aspect that has become clear is that effectively assessing value involves taking a broader perspective. Looking beyond financial factors. This will become an increasingly dominant trend in how we measure both economic and societal progress, and as investors we have the means to positively influence it.”
Stocks moved slightly higher in June as investors remain optimistic over the benefits of a reopening economy. However, a growing number of COVID-19 hotspots in several US states has threatened the momentum of a recovering economy and created concern over the potential resurgence in recovering states. Information technology stocks continued their success from previous months and consumer discretionary companies benefited from encouraging data from auto suppliers and homebuilders.
Tensions continued to rise between the relationship of the United States & China. Uncertainty exists between key Chinese diplomats and US officials over their trade-agreement commitments. Investor attention is increasingly turning to the upcoming US presidential election between President Trump and the presumptive Democratic nominee, Joe Biden.
The Fed had signaled their objective to continue supporting an economic recovery. Both Congress & the White House expressed their intentions for another round of stimulus funding. The potential for expanded unemployment benefits, tax cuts or industry-specific stimulus could provide direct aid to households and help jumpstart the economy.
As investors eagerly wait for more news in regard to a vaccination, markets have been volatile and fragile during this bumpy recovery. We continue to use this volatility as an opportunity to buy attractive companies, which have positive free cash flows and healthy balances sheets, at discounted prices, and seek companies that can both withstand continued economic fallout from the pandemic as well as thrive when it ends.
In the Merger Arbitrage world, returns in June were largely driven by completed deals, as well as continued progress on deals in the pipeline. Notably, we have seen some spreads revert to pre-COVID levels. We are retaining some dry powder, but we continue to deploy capital in situations that present the highest likelihood of success and certainty of value.
We are seeing early signs of a return to deal making as we move beyond the air pocket created by COVID-19. The Federal Reserve and other central banks have unleashed unprecedented liquidity that should provide an accommodative market for new issuances and M&A. CEOs and Boards of Directors continue to seek ways to create shareholder value in an increasingly global marketplace, while competing with disruptors and a consumer base that is shifting online at an increased pace. This includes both M&A and financial engineering, which can spur deal activity. We previously mentioned that Grubhub and Uber were in deal discussions, which led to two separate transactions in the food delivery space, propelled by the evolving consumer environment: Grubhub/JustEat and Uber/Postmates.
Column by Gabelli Funds, written by Michael Gabelli
To access our proprietary value investment methodology, and dedicated merger arbitrage portfolio we offer the following UCITS Funds in each discipline:
GAMCO MERGER ARBITRAGE
GAMCO Merger Arbitrage UCITS Fund, launched in October 2011, is an open-end fund incorporated in Luxembourg and compliant with UCITS regulation. The team, dedicated strategy, and record dates back to 1985. The objective of the GAMCO Merger Arbitrage Fund is to achieve long-term capital growth by investing primarily in announced equity merger and acquisition transactions while maintaining a diversified portfolio. The Fund utilizes a highly specialized investment approach designed principally to profit from the successful completion of proposed mergers, takeovers, tender offers, leveraged buyouts and other types of corporate reorganizations. Analyzes and continuously monitors each pending transaction for potential risk, including: regulatory, terms, financing, and shareholder approval.
Merger investments are a highly liquid, non-market correlated, proven and consistent alternative to traditional fixed income and equity securities. Merger returns are dependent on deal spreads. Deal spreads are a function of time, deal risk premium, and interest rates. Returns are thus correlated to interest rate changes over the medium term and not the broader equity market. The prospect of rising rates would imply higher returns on mergers as spreads widen to compensate arbitrageurs. As bond markets decline (interest rates rise), merger returns should improve as capital allocation decisions adjust to the changes in the costs of capital.
Broad Market volatility can lead to widening of spreads in merger positions, coupled with our well-researched merger portfolios, offer the potential for enhanced IRRs through dynamic position sizing. Daily price volatility fluctuations coupled with less proprietary capital (the Volcker rule) in the U.S. have contributed to improving merger spreads and thus, overall returns. Thus our fund is well positioned as a cash substitute or fixed income alternative.
Our objectives are to compound and preserve wealth over time, while remaining non-correlated to the broad global markets. We created our first dedicated merger fund 32 years ago. Since then, our merger performance has grown client assets at an annualized rate of approximately 10.7% gross and 7.6% net since 1985. Today, we manage assets on behalf of institutional and high net worth clients globally in a variety of fund structures and mandates.
Class I USD – LU0687944552
Class I EUR – LU0687944396
Class A USD – LU0687943745
Class A EUR – LU0687943661
Class R USD – LU1453360825
Class R EUR – LU1453361476
GAMCO ALL CAP VALUE
The GAMCO All Cap Value UCITS Fund launched in May, 2015 utilizes Gabelli’s its proprietary PMV with a Catalyst™ investment methodology, which has been in place since 1977. The Fund seeks absolute returns through event driven value investing. Our methodology centers around fundamental, research-driven, value based investing with a focus on asset values, cash flows and identifiable catalysts to maximize returns independent of market direction. The fund draws on the experience of its global portfolio team and 35+ value research analysts.
GAMCO is an active, bottom-up, value investor, and seeks to achieve real capital appreciation (relative to inflation) over the long term regardless of market cycles. Our value-oriented stock selection process is based on the fundamental investment principles first articulated in 1934 by Graham and Dodd, the founders of modern security analysis, and further augmented by Mario Gabelli in 1977 with his introduction of the concepts of Private Market Value (PMV) with a Catalyst™ into equity analysis. PMV with a Catalyst™ is our unique research methodology that focuses on individual stock selection by identifying firms selling below intrinsic value with a reasonable probability of realizing their PMV’s which we define as the price a strategic or financial acquirer would be willing to pay for the entire enterprise. The fundamental valuation factors utilized to evaluate securities prior to inclusion/exclusion into the portfolio, our research driven approach views fundamental analysis as a three pronged approach: free cash flow (earnings before, interest, taxes, depreciation and amortization, or EBITDA, minus the capital expenditures necessary to grow/maintain the business); earnings per share trends; and private market value (PMV), which encompasses on and off balance sheet assets and liabilities. Our team arrives at a PMV valuation by a rigorous assessment of fundamentals from publicly available information and judgement gained from meeting management, covering all size companies globally and our comprehensive, accumulated knowledge of a variety of sectors. We then identify businesses for the portfolio possessing the proper margin of safety and research variables from our deep research universe.
Class I USD – LU1216601648
Class I EUR – LU1216601564
Class A USD – LU1216600913
Class A EUR – LU1216600673
Class R USD – LU1453359900
Class R EUR – LU1453360155
Disclaimer:
The information and any opinions have been obtained from or are based on sources believed to be reliable but accuracy cannot be guaranteed. No responsibility can be accepted for any consequential loss arising from the use of this information. The information is expressed at its date and is issued only to and directed only at those individuals who are permitted to receive such information in accordance with the applicable statutes. In some countries the distribution of this publication may be restricted. It is your responsibility to find out what those restrictions are and observe them.
Some of the statements in this presentation may contain or be based on forward looking statements, forecasts, estimates, projections, targets, or prognosis (“forward looking statements”), which reflect the manager’s current view of future events, economic developments and financial performance. Such forward looking statements are typically indicated by the use of words which express an estimate, expectation, belief, target or forecast. Such forward looking statements are based on an assessment of historical economic data, on the experience and current plans of the investment manager and/or certain advisors of the manager, and on the indicated sources. These forward looking statements contain no representation or warranty of whatever kind that such future events will occur or that they will occur as described herein, or that such results will be achieved by the fund or the investments of the fund, as the occurrence of these events and the results of the fund are subject to various risks and uncertainties. The actual portfolio, and thus results, of the fund may differ substantially from those assumed in the forward looking statements. The manager and its affiliates will not undertake to update or review the forward looking statements contained in this presentation, whether as result of new information or any future event or otherwise.
Foto cedidaMina Lazic, new Relationship Manager at AIS Financial Group. Mina Lazic, new Relationship Manager at AIS Financial Group
AIS Financial Group has hired Mina Lazic as new Relationship Manager. The firm announced in a press release that she will report directly to Samir Lakkis, founding partner.
Lazic has 12 years of work experience as Global Markets Sales, working in investment banks in London. In her last role, she was Executive Director in Nomura, responsible for Cross-Asset Sales for Russia and CIS. Previous to that, she spent 8 years with Société Générale, selling FX, Rates, Credit, Flow and Structured products to FI clients in CEE, Russia, CIS, Greece, Cyprus and Austria, among others.
Lazic started her career in Merrill Lynch as Equity Derivative Sales and she holds a Masters in Finance and a Bachelors in International Economics and Management Degree from Bocconi University in Milan, Italy.
AIS currently distributes over 1 billion dollars a year in structured products and is now broadening its business line, distributing third-party funds. With offices in Madrid, Geneva, Bahamas and Panama, the company will look to partner with those managers who want to outsource their sales force and “benefit from the knowledge and experience” that they have in the region.
Foto cedidaLuther Bryan Carter, new Head of Global Emerging Markets Debt at HSBC Global AM. HSBC Global AM nombra a Luther Bryan Carte responsable de deuda global de mercados emergentes
HSBC Global Asset Management announced the appointment of Luther Bryan Carter as Head of Global Emerging Markets Debt, effective immediately. Based in London, he will report to Xavier Baraton, Global CIO Fixed Income, Private Debt and Alternatives.
The asset manager explained in a press release that in his new role, Carter will be responsible for the management of the global EMD team, investment process and portfolios, after the completion of due diligence and regulatory approval. “While taking immediate oversight responsibility for all investment decisions, his first initiative and focus will be on deepening the country research function”, they added.
Carter will take over from Nishant Upadhyay, who will remain with the firm and will focus on fixed income investment platform projects. The firm thanked Nishant for his contributions to the business since joining in 2016.
Xavier Baraton, Global CIO Fixed Income, Private Debt and Alternatives, said: “Bryan has a strong track record in the industry and will play a leading role in strengthening our EMD investment process. Global EMD remains our key capability and Bryan’s appointment is testament to our commitment to managing these assets with the skill, expertise and stewardship that our clients expect.”
Bryan has nearly 20 years’ industry experience, most recently as the award-winning lead portfolio manager for EMD at BNP Paribas Asset Management, where he hired and led a team of 16 professionals and significantly increased the firm’s EMD asset base. Prior to joining BNP Paribas, he worked at Acadian Asset Management, T Rowe Price and as an economist at the US Treasury Department.
HSBC Global AM stated that Carter has “strong ESG credentials” having developed and implemented an innovative ESG process for EMD at BNP Paribas. Since 2014, he has been deeply involved in the Emerging Markets Investors Alliance, a leading global non-profit network of institutional investors committed to advancing sustainable social and economic development in emerging markets.