The Headlines Are Relentless, but the News Isn’t All Bad

  |   For  |  0 Comentarios

No todo son malas noticias
CC-BY-SA-2.0, FlickrPhoto: Allan Ajifo. The Headlines Are Relentless, but the News Isn't All Bad

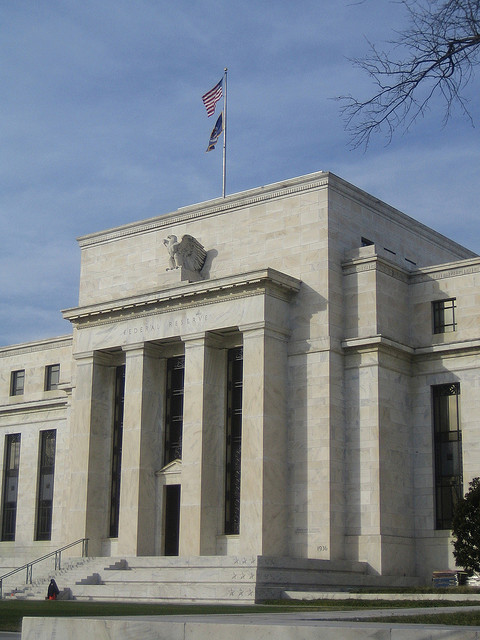
So far in 2016, the headlines have been somewhat harrowing: China imploding. Banking problems in Europe. Devastation in the oil patch. To be sure, there are reasons for concern. World trade is declining on a year-over-year basis. We’re not yet at recession levels, but there is a slowdown. What is not yet clear is whether the slowdown will be temporary or prolonged.

China remains a major concern as it attempts to transition from an export-driven society to one based on consumption. Both imports and exports have been declining, and concerns over China’s banking sector are mounting. Thankfully, Chinese debt is not owned by many investors outside the country, so a Chinese debt or banking crisis, while painful, would likely not have the same sort of global ripple effects that the US mortgage crisis did in 2007–2009.

Consumption creeps up

Meanwhile, the Chinese consumer is beginning to carry more weight. Consumption is growing year over year, and housing markets have picked up in China in recent months. I don’t anticipate implosion taking place there.

Europe is a mixed bag at the moment. While German exports are slowing, consumption in the eurozone is picking up and easy monetary policy remains in place. Japan’s diversified economy is in the midst of a multiyear re-engineering push — but without much to show for it thus far.

US consumer spending accounts for a larger share of the global economy than the entire economic output of China does. And US consumers kicked into gear in January. Apparently they didn’t get the memo about all the bad news in the rest of the world. US real incomes are rising, wages are growing and both the number of workers and their hours worked are climbing.

Overall, the global backdrop does not suggest an imminent recession.

Corrections don’t necessarily signal recessions

History tells us that market declines like we’ve seen so far in 2016 don’t always signal a recession. Since 1959, there have been 11 declines in the S&P 500 of the magnitude we’ve seen in recent months —between 10% and 19% declines. Three of those episodes ended in recession, while the other eight did not. The average decline during those eight episodes was approximately 16%. And just six months after the decline ended, the average return on the S&P was 18%–19%. It’s also worth noting that the average forward P/E ratio in those periods was 19 to 20 times. Today it is a more reasonable 15½ times.

Still some work to do

So are we headed for a recession? In my opinion, there isn’t a “yes” or “no” answer, but rather a two-stage process at work. The continued fall in oil prices —largely due to falling demand from China— is an input cost, and falling costs will initially cause some capital destruction. No doubt there will be defaults by energy companies that are geared to crude oil prices of $70, $80 or $100 per barrel. However, once the loss of capital works its way through the system, there will be a boost to manufacturing in the form of higher profits based on lower input costs.

As another ripple effect of China’s recent woes, the decline in commodity prices is suppressing expectations of higher interest rates — the cost of capital. Now we have two input costs that are likely to remain relatively low for the balance of 2016. And those should eventually benefit big economies like the US, the eurozone, Japan and, strangely enough, China itself.

Anxiety is understandable, and investors are wise to be cautious. It is probably best for investors to hold back a bit and to watch the macroeconomic data for the world’s major economies in the next few months. That should help us figure out if the worst of the crisis has passed.

James Swanson is Chief Investment Strategist at MFS Investment Management.

Listed Real Estate As An Income Investment

  |   For  |  0 Comentarios

Tres ventajas de incluir REITs en los portafolios orientados a rentas
CC-BY-SA-2.0, FlickrPhoto: Cucho Schez. Listed Real Estate As An Income Investment

The role that listed real estate can play in portfolio management is evolving, and there are three factors in particular which have been instrumental in determining how this sector can contribute positively to risk-adjusted returns for income-oriented funds.

The first factor is simply size. At the end of February 2009 the free float market capitalisation of the EPRA Global Index was US$297 billion and the sector represented just 1.1% of the global equity market. Fast forward to December 2015 and the free float market capitalisation of the EPRA Global Developed Market Index is now US$1,284 billion (a fourfold increase) and represents 2.7% of the global equity market (source: EPRA). As a result the investable universe of liquid global real estate stocks has expanded considerably.

Secondly, the sector has a unique structure. Real Estate Investment Trusts (REITs) are obliged to distribute a high, fixed, percentage (typically 90%) of their income as dividends. If they meet this requirement they are typically exempt from corporate and Capital Gains Tax. As a result REITs combine the liquidity benefits of equities, with attractive income characteristics, and total returns driven by real estate factors. REITs account for around 70% of the EPRA Global Index and are the predominant structures in the US, UK, Europe and Australia.

Thirdly, valuation. The yield on the EPRA Global Developed REIT Index tended to trade below that of the Merrill Lynch Global Investment Grade Bond Index prior to the Global Financial Crisis. Since then, the reverse has generally been the case with REIT yields trading at a premium even after the recent sell-off in corporate bonds.

Preferred characteristics

However, a significant yield premium is only one part of the valuation picture. The other component is the level of anticipated growth in rental and capital values, which translates through to dividends and Net Asset Values (NAV) at the company level. It is here where we see different geographic areas displaying different growth trajectories, due to variances in local supply/demand dynamics. In this regard we can split the sector into three categories; regions with positive rental growth such as the UK, US, Japan and Australia; those with flatter growth profiles such as Europe and Canada; and those with declining rental values including Hong Kong and Singapore.

Our preference is to invest in those companies which have a decent starting yield, positive rentals and NAV growth projections, a high quality real estate portfolio, experienced and high quality management, and sensible leverage, broadly those with loans to value of under 40%.

What about rising interest rates?

Clearly, there are concerns about the impact of rising interest rates on real estate values, and as a result real estate shares. However, there are a number of reasons why we believe that the impact of potential issues could be muted. Firstly, as discussed previously current pricing of the sector, with a dividend yield of around 4.1%, and a discount to NAV of c.9% provides a reasonable ‘buffer’ against rises in bond yields. Secondly, in terms of valuation yields on direct property a significant proportion of the capital which is targeting the sector is equity, not debt, so rises in financing costs may have limited impact on values. As an example in 2015 Blackstone raised US$15.8 billion for its latest global real estate fund. Thirdly there is a level of rental growth already embedded in forecasts, and we anticipate dividend growth of 3.5% p.a. over the next three years. Finally, any rise in bond yields is likely to be limited by low inflation, slow GDP growth and cautious central banks.

Conclusion

We believe that selective listed real estate companies have a valuable role to play in income focussed funds at the present time, due to a combination of a dividend yield premium, stable cash flows, and attractive growth prospects.

John Stopford is Co-Head of Multi-Asset at Investec.

My Kingdom for a Hedge

  |   For  |  0 Comentarios

Si la deuda pública de los países desarrollados ya no actúa como un elemento defensivo en las carteras, ¿qué activo puede sustituirla?
CC-BY-SA-2.0, FlickrPhoto: Manuel. My Kingdom for a Hedge

Yet again most developed government bonds have proved their worth as a defensive hedge in the recent market turmoil. However, with yields at historically low levels and entering negative territory in a number of cases, the protective quality of such exposure in the future is surely becoming more doubtful. Recent market price action arguably suggests that market participants have increasingly abandoned bonds as material defensive positions in portfolios, in favour of ‘procyclical risk management’ which is designed to protect returns and mute any drawdowns in a generally rising market environment.

Lately, for example, we have seen a scramble to buy hedges to lower or cap increasing risk, as measured by short-term volatility. Given poor liquidity, there has also been a significant expansion in the use of proxies (designed to mimic the behaviour of traditional hedging instruments) to hedge positions, which in turn increases correlations. This can often result in ‘technical factors’ overwhelming fundamentals and contributing to bearish sentiment.

We have long been advocates of taking a broader view of the ‘defensive’ opportunity set and focusing on the qualities of structural diversification, rather than relying excessively on short-term market timing, particularly if it is reactive, to manage risk. If the laws of diminishing defensiveness increasingly apply to government bonds, what might take their place? This is a difficult question because bonds have typically paid investors a return and were generally reliably inversely correlated with growth assets.

Sadly, this golden era is largely in the past. Hedging is becoming more costly and less reliable. The behaviour of more complex defensive assets, when their qualities are needed, is more difficult to predict than more conventional hedges. Volatility-protection strategies are a good example of this, as they can show an alarming tendency to diverge from the underlying asset.

Despite its impressive recent performance, even a more conventional hedge, such as gold, pays no income and can be costly in terms of drawdown.

So what other defensive options are there? We would argue that currencies have long provided a fertile defensive opportunity set. Typically the currencies of credit or nations, such as Switzerland and Japan, have offered safe havens (although the yen lost this status under prime minister Shinzo Abe and governor of the Bank of Japan Haruhiko Kuroda), and periodically the US dollar by dint of its ‘world currency’ status. Naturally, as the depreciation of the Norwegian krone in the recent past reminds us, cyclical context and valuation remain important considerations, even if longer-term structural fundamentals are robust.

Taking short positions against currencies with poor or deteriorating macroeconomic fundamentals greatly expands the opportunity set. The Australian dollar was one of the main beneficiaries of China’s boom and as a consequence was driven up to unsustainable levels. Selling that currency forward proved to be an excellent hedge against general emerging market weakness, as it declined by 37.7% from a peak in November 2011 to its recent trough. More generally, the principle of shorting growth assets to create defensive ones applies more broadly than currencies.

In short, we need to consider the broadest range of defensive assets in order to sustain structural diversification in portfolios at a time when the traditional defensive ‘armoury’ is becoming challenged. True, this opportunity set is in some cases difficult to access and requires additional technical skills and competence, but we believe the alternative of placing undue reliance on market timing and the standard risk models is misguided.

Philip Saunders is Co-Head of Multi-Asset at Investec.

Abenomics in Crisis

  |   For  |  0 Comentarios

¿Corre Abenomics peligro de fracasar?
CC-BY-SA-2.0, FlickrPhoto: Chan Chen. Abenomics in Crisis

Japan’s economy contracted at an annualized rate of -1.4% in the fourth quarter. That was much worse than the Bloomberg consensus was looking for. Declining industrial production and weak household spending had pointed at renewed contraction risk. Most Japan watchers were probably focusing on the country’s composite PMI index, which improved to 52.3 in Q4 the best quarter in nearly two years.

Japan has already seen three recessions since 2009. In fact, in six years starting in 2010, Japan’s GDP has contracted in 11 out of 24 quarters(!). Amazingly the economy has still not recovered from the ill-advised Consumption Tax hike in April of 2014. Private consumption declined again in Q4 and is now 5.4% below the pre-tax hike peak.

The decline in consumer spending has been more than twice as large as the consumption contraction during in the 2008/09 financial market crisis. That’s astonishing for such the relatively small tax increase and for an economy essentially on full employment. Residential investment contracted mildly last quarter and inventories shaved 0.5% off the quarterly growth rate. The only bright spot was a 5.7% annualized increase in business investment.

Where is government?

I am surprised we are not seeing more fiscal spending in Japan. The government had promised to offset the Consumption Tax increase with fiscal stimulus, which never materialized. The average contribution to quarterly GDP growth after the second quarter of 2014 was a mere 0.2%.

The weak growth trend in Japan is another serious blow to the effectiveness of monetary policy as a growth stimulus tool. The Bank of Japan has been buying about $70 billion worth of bonds and ETFs every month for the past three years with very little growth or inflation to show for. Now the BOJ is trying negative interest rates, a tool that has not been tested and whose side effects are not yet fully understood.

Japan is trapped in a low interest rate world. What the economy needs is a significantly weaker currency to boost inflation, corporate profits and wages. Yet, with global interest rates unwilling to rise, the BOJ evidently felt compelled to widen the interest rate differential by further lowering Japanese rates. So far we haven’t seen any lasting effect on the yen.

Forecast impact.

Similar to the US, Japan will struggle to exceed last year’s growth rate in 2016. The sharp decline at the end of last year has lowered the starting point for 2016 such that even the 1.3% average quarterly growth rate we are forecasting will only add up to 0.5% growth for the full year. Like in the US, looking at the Q4/Q43 growth rate will be more informative about the growth momentum. Here we expect a modest improvement from the 0.7% last quarter to 1.2% at the end of this year.

Abenomics is in danger of failing. Structural reforms have done little to raise Japan’s actual growth rate. The damage from last year consumption tax still dominates the household sector, reflecting the lack of  income growth, which could have offset the modest tax hike. Absent faster rate hikes in the US there is little the Bank of Japan can do to stimulate growth and the focus is shifting back to fiscal policy.

Much of that is likely to be timed for the June Upper House elections where the ruling LDP enjoys a big majority. Elections for the Lower House where the cushion is much thinner aren’t required until 2018. So Prime Minister Abe has two more years to turn the economy around. More stimulative fiscal policy and greater efforts to weaken the yen as the year progresses should eventually boost growth and help Japan avoid a fourth recession since 2009.        

Markus Schomer is a Managing Director and Chief Economist of PineBridge Investments.


Gold Now?

  |   For  |  0 Comentarios

Gold Now?

Gold never changes; it’s the world around it that does. Why is it that we see a renewed interest in gold now? And more importantly, should investors buy this precious metal?

Key attributes in a ‘changing world’ that may be relevant to the price of gold are fear and interest rates. Let’s examine these:

Gold & Fear
When referencing ‘fear’ driving the markets, most think of a terrorist attack, political uncertainty or some other crisis that impacts investor sentiment, and sure enough, at times, the price of gold moves higher when this type of fear is observed. While that may be correct, I don’t like an investment case based on such flare-ups of fear, as I see such events as intrinsically temporary in nature. We tend to get used to crises, even a prolonged terror campaign or the Eurozone debt crisis; whateveras the ‘novelty’ of any shock recedes, markets tend to move on.

Having said that, I believe fear is under-appreciated – quite literally, although in a different sense. Fear is the plain English word for risk aversion. When fear is low, investors may embrace “risk assets,” including stocks and junk bonds. A lack of fear suggests volatility is low; as such, investors with a given level of risk tolerance may understandably re-allocate their portfolios so that the overall perceived riskiness of their portfolio stays the same. While retail investors might do this intuitively, professional investors may also do the same, but use fancy terminology, notably that they may target a specific “value at risk,” abbreviated as VaR. Conversely, our analysis shows that when fear comes back to the market – for whatever reason – ‘risk assets’ tend to under-perform as investors reduce their exposure.

Assuming you agree, this doesn’t explain yet why gold is often considered a ‘safe haven’ asset when the price of gold is clearly volatile. To understand how the price of gold is affected relative to risk assets, we foremost need to understand how risk assets move; after all, remember our premise that gold doesn’t change, the world around it does.

A traditional way to value a risky asset is with a discounted cash flow analysis. With equities, for example, one adds up expected future earnings, but discounting the future earnings stream.  When future cash flows are uncertain, analysts apply a higher discount factor to future earnings, thereby deriving a lower value. When investors apply a high discount factor – be that because they are uncertain about the business (think of unproven biotech or young tech firms) or about the market as a whole (a broader sense of fear), we believe this theory dictates a greater focus on short-term cash flows (as future cash flows are more heavily ‘discounted’). As a result, we believe it’s reasonable for share prices to be lower and more volatile when fear is higher.

If you have followed me so far, you may be thinking: but gold doesn’t pay any dividends! Correct, and that’s why we reason that the price of gold is not as affected by changes in the ‘fear factor’ because, again, gold doesn’t change.

Note that it is not correct that gold always does well when ‘risk is off’ in the markets. There are periods when the price of gold moves in the same direction as equity indices; and there are times when it moves in the opposite direction. In fact, since former President Nixon severed the tie between the U.S. dollar and the price of gold in 1971, we have observed a zero correlation to equities. And that is how it should be given that the cash flows of gold (of which there aren’t any) are not correlated to the cash flows of corporations.

Ultimately, of course, prices are dictated by supply and demand. And even as gold may not have cash flows associated with it, the supply and demand of gold may be related to the health (expected cash flows) of users and producers. It’s in this context that I often mention that we believe gold is less volatile than other commodities because it has less industrial use. Taking copper, for example, it doesn’t change either (well, it oxidizes), but supply and demand dynamics are far more elastic (volatile).

And of course, just like any asset, prices can be distorted, even for a considerable period. For example, I allege that the price of gold moves more like a ‘risk asset’ when gold has been hijacked by momentum investors, thereby potentially turning it into a proverbial hot potato.

With this framework provided, let me get to a point I have been making about the markets for some time: in our analysis, the Federal Reserve, in conjunction with other central banks, worked hard to take fear out of the markets. That is, central banks “compressed risk premia,” i.e. making risk assets appear less risky. As a result, risk assets from stocks to junk bonds rose on the backdrop of low volatility (when junk bond prices rise, their yields fall). Conversely, as the Fed is trying to engineer an exit, we believe risk premia will rise again. All else equal, we believe this suggests more volatility (more fear) and lower equity prices.

If you agree with the logic outlined here, an environment in which the Fed is pursuing an exit may be favorable to the price of gold. And it’s not because investors are fearful of another terrorist attack, it’s because fear has been suppressed, yet the world is a risky place; and if market forces have it their way, fear as a healthy part of the markets will return. It also means that, all else equal, we believe the price of gold should be higher relative to equities.

Gold & Interest Rates
But all else isn’t equal, as interest rates might be moving higher. At least that was the story we were told for years as the Fed was preparing the markets for an ‘exit’. Given that markets tend to be forward looking, investors seemed to be fleeing the precious metal. After all, the real competition to a shiny brick that doesn’t pay any interest may be cash that does pay interest. Cash, though, is an artificial construct, and investors have every right to be skeptical. Notably, investors may care more about the real interest they receive on cash, i.e. the interest after inflation is taken into account. While we are told what inflation rates are through official statistics, investors may choose their own perception of inflation in making investment decisions.

Instead of high rates, the world appears to be in a rush to go negative. Bloomberg in its Feb 22, 2016, Economics Brief wrote that one third of 47 countries in their global survey have negative 2-year government bond yields. Sure, in the U.S. rates are positive, but will the Fed be able to pursue its exit? Can we get real interest rates that are significantly positive? Or are we heading the other direction, i.e. is an economic slowdown coming that might take rates down further? In a recent editorial in the Washington Post, former U.S. Treasury Secretary Larry Summers “puts the odds of a recession at about 1/3 over the next year and at over 1/2 over the next 2 years.” He then suggests that a “400 basis point cut in Fed funds … is normally necessary to respond to an incipient recession.”

While I don’t encourage anyone to base their investment decisions on Larry Summers’ musings (at least not unless he takes Fed Chair Yellen’s job), I don’t see real interest rates moving higher anytime soon. Larry Summers’ scenario may be positive for gold, although – if we had rate cuts, it might, of course, compress risk premia once again, taking fear out of the markets…

The way we assess the Yellen Fed is a bit like an ocean tanker, i.e. it moves very slowly. The reasons for that we discussed in a recent Merk Insight, but have mainly to do with the fact that Yellen is a labor economist and, as such, typically looks at data that will lag developments in the real economy. To us, this suggests risk premia may continue to widen (causing risk assets to remain under pressure), and that any rally in the markets may be a bull trap, i.e. deceptive. In our assessment, investors are likely to use rallies to diversify their portfolios as they continue to be over-exposed to equities and other risk assets. The question is whether gold will be part of their diversification efforts. We think investors may want to consider adding a gold component to their portfolio.

For more information you can join Axel Merk’s ‘Gold to Beat Stocks?’ on Thursday, February 25.

Investigating the Market Correction

  |   For  |  0 Comentarios

La liquidez sigue siendo el reto clave
CC-BY-SA-2.0, FlickrPhoto: Tony Hisgett. Investigating the Market Correction

After any dramatic market sell-off there is invariably a flurry of after-the-event rationalisation, an exercise in ‘Who done it?’. Many believe the trigger of the current sell-off was pulled by the People’s Bank of China in December when it moved to measure the value of the renminbi against a basket of currencies rather than the dollar, which made it easier to devalue the currency by circa 1.4%.

As was the case last August, this was interpreted as further evidence of an increasing risk of a hard landing for the Chinese economy, and the inevitability of a substantial devaluation with its attendant deflationary implications. Huge though they are, Chinese foreign exchange reserves were apparently at risk of being overwhelmed by burgeoning capital outflows.

The US Federal Reserve Board (Fed) also made it on to the ‘who done it’ list. The risk of the Fed raising interest rates, in the teeth of increasingly alarming evidence of weakness in the US manufacturing sector, and the conflict in statements from its senior board governors, suggested a determination to fight inflationary, rather than deflationary, forces. Other suspects include plummeting oil prices, (which have been causing sovereign wealth fund asset liquidation and forcing banks to write off loans), deteriorating liquidity, pro-cyclical risk management and high frequency trading. In short, markets are full of convexity (interest rate risk) and prone to more violent, but episodic shocks.

Where now?

We continue to expect a weak, but positive, global growth outcome in 2016, believing recession risks in the key developed economies to be exaggerated.

In our view, oil price weakness is very much a supply problem rather than an indicator of collapsing demand, which continues to rise and, in any event, it has more than likely over-shot on the downside. Although disruptive in the shorter term, weak commodity and especially oil prices should, ultimately, be significant positive drivers for global growth. In contrast to manufacturing, the much larger consumer sector is in reasonably good shape across the developed world and the shift in the balance of demand will continue to move in the latter’s favour.

Despite the market angst, our view is that China’s economy is slowing down in a relatively measured manner and the capital outflow scare is wildly exaggerated. This is not to deny the transitional challenges it faces and that there are downside risks. If the Fed does raise rates in line with the higher estimates, it will be against a background of a strengthening US economy. For now, despite the downgrades, forecast earnings in the US, Europe and Japan remain positive.

Liquidity, the key challenge

Liquidity remains the key challenge. Tighter US monetary conditions and the anticipation of further tightening has caused emerging market liquidity to swing from abundance in the heyday of quantitative easing to scarcity now. This has effectively offset looser monetary policy in Europe and Japan. Paradoxically, global monetary conditions appear to be much more restrictive than the low level of nominal and real interest rates would seem to imply. Contrary to expectations, the Bank of Japan have effectively expanded their quantitative easing programme further, with the introduction of negative interest rates and the European Central Bank has intimated that it could do the same. A recognition of this on the part of the Fed in 2016 could well prove decisive in reducing the risk of more negative outcomes.

The return of Ro-Ro

We, therefore, believe the period ahead is likely to prove to be one of uncertainty and transition, not unlike the ‘risk-on, risk-off’ period we saw between 2010 and mid- 2012. Portfolio resilience will remain a particularly important theme, which requires selectivity in terms of the choice of defensive assets. Among these long-dated US Treasuries, the yen and the euro are our current preferences. Interestingly the dollar, which admirably fulfilled that role over the last three years, may be losing some of its lustre against other developed market currencies. Arguably, the US dollar has moved far further than likely real rate divergence really justifies.

In our view, equities, especially after the recent market weakness, are not trading at excessive valuations. Risk premia relative to bonds are high, if, as we suspect, bond yields are going to remain low on a structural basis. Patience may still be required with regards to assessing value asset classes that are repricing, such as high yield bonds and emerging market currencies and debt. However, selective opportunities are arising where risk premia have risen to levels that should prove to be attractive over the medium to longer term.

Finding bottom-up equity opportunities

From a bottom-up equity perspective, as has been the case for a while, it should still prove to be a challenging environment for cyclical stocks, with investors likely to continue to be prepared to pay up for ‘quality’. There is ‘value’ in the out-of-favour financial, materials and energy sectors, but earnings dynamics remain resolutely negative. Established technology stocks are one of the few subsectors that could be described as squaring the circle between quality and value and, as such, are a favoured area.

In a more volatile environment there is a general assumption that the large index constituent stocks should be preferred. However, the dynamics of indexation may have reached a tipping point, because our bottom-up steers are favouring the merely large cap and mid cap stock territories and ‘active shares’ in our equity allocations are high. We believe volatility will continue throughout 2016, which will increase the need for portfolio resilience. Investing in quality stocks should help to navigate this environment.

Philip Saunders is Co-Head of Multi-Asset at Investe.


Oil Markets: Brent Crude Oil will Average USD 40/bbl in Six Months’ Time

  |   For  |  0 Comentarios

Oil Markets: Brent Crude Oil will Average USD 40/bbl in Six Months’ Time

At the time of writing, crude oil is trading at USD 32.51/bbl and USD 29.04/bbl on the Brent and WTI spot markets respectively. Both oil benchmarks have lost around 14% and 22% respectively year to date and have dropped to their 2004 levels.

Towards the end of January and in early February, oil markets registered a brief rally. It has now expired despite the encouraging news that US unconventional oil production is falling and discussions between OPEC and Russia to reduce oil supply, with the publication of new OECD data showing higher oil & distillates inventories and rising risks of global recession. This sent spot oil markets plummeting 8% in London and 12% in New York in the first two weeks of February.

The oil market imbalance is set to persist throughout the year, though easing gradually in the second half of 2016.

The latest news of the talks between Saudi Arabia and Russia is that they have agreed to freeze their oil production if they are joined by other major producers. Subject to a broader and more definite agreement, we forecast that Brent crude oil will average USD 40/bbl in six months’ time.

In terms of demand, despite mounting concerns surrounding Europe and emerging markets, the three forecasters (EIA, AIE, OPEC) that the market follows stand by their expectations for 2016. Global demand should increase by 1.2 MMbbl/d to 95.6 MMbbl/d following stellar growth of 1.9 MMbbl/d in 2015.

Emerging countries represent more than 52% of global demand. They have been the drivers of global demand for the last ten years, and should remain so despite the weakness of China’s demand. The IEA expects oil demand to increase in 2016 by 1.1 MMbbl/d (2.3%) to 49.4 MMbbl/d for non-OECD countries and by 3.1% (vs. 5.6% in 2015) to 11.6 MMbbl/d only for China.

The IEA expects OECD demand to remain flatwhile the EIA and OPEC are forecasting a rise of just 0.2% y/y. In the US, total liquid fuel consumption is forecast by the EIA to increase by 0.8%, compared to 2015.

As for the supply, after expanding by 2.6 MMbbl/d in 2015, global oil supply should increase only slightly, by 0.5 MMbbl/d to 96.8 MMbbl/d, in 2016.

In 2016, non-OPEC supply should decline by around 0.7 MMbbl/d to 57 MMbbl/d. The global downside will be driven by lower US unconventional supply and complemented by decreasing production in China, Norway and the North Sea area. Crude oil production by the seven major US shale players is expected to fall in February by 116,000 bbl/d to 4.83 MMbbl/d, according to the EIA.

Lastly, OPEC production in 2016 should increase by 0.9 MMbbl/d to 32.9 MMbbl/d, up from 30.9 MMbbl/d in 2015. Iran might also increase its supply by 0.5 MMbbl/d following the lifting of the sanctions.

Opinion column by Erasmo Rodriguez, Equities Analyst at Union Bancaire Privée (UBP), specialiced in Energy and Utilities sectors.

The Japanese Equity Outlook After the Nasty New Year Start

  |   For  |  0 Comentarios

Perspectivas para la renta variable japonesa tras un desagradable inicio de año
CC-BY-SA-2.0, FlickrPhoto: Takadanobaba Kurazawa. The Japanese Equity Outlook After the Nasty New Year Start

An outlook for any major asset market likely involves QE, so a comment on such is firstly warranted. Clearly, it is wrong to state definitively that QE works or not in any given country, as one can only make an educated guess as to whether events would have been better or not, in sum, compared to a counter-factual estimate of what would have occurred without QE. In that sense, it seems QE has done far more good than harm for participating countries, especially when one recalls the dark days of 2009 and the various European crises.

More recently, QE (in either balance sheet holdings or new purchases forms) has helped counter one of the greatest deflationary factors in world history, which has occurred outside the control of central banks: shale drilling. Major technological inventions often cause boom and deflationary bust cycles, but have rarely, if ever, have affected the world’s most important commodity in such substantial way. The effect on the oil price did not occur immediately, but when it did, the 80% decline, also partly caused by geopolitically-driven factors, was astonishing. This is another reason to ignore those who state that QE failed to create inflation in Japan or elsewhere, as shale drilling was an uncontrollable external factor, and inflation would likely have been much lower without QE. Indeed, a global depression was a likely counterfactual scenario. One must also realize that deflation characterizes only commodity prices and quality-adjusted technology goods, whereas the most important asset class in the world, real estate, is quite significantly inflating, greatly due to QE’s effects.

In the current equity environment, one of the most important aspects of QE is its effect on corporate profits. Of course, forex rates are affected by QE, so the size of one country’s QE is important in relation to other countries’ QE, and the forex rate significantly influences corporate profits. In this regard, Japan has clearly benefited more than the West in recent years due to its massive QE program. QE also lowers interest costs, which usually increases capital expenditure and personal consumption, at least compared to what would have occurred without QE, which contribute to corporate earnings, as well.

With QE, the Yen reversed its overvaluation and confidence in general increased greatly. Asset prices, including equities, increased, partly due to increased valuation metrics, but mostly due to the rise in underlying earnings. Indeed, earnings growth expectations in Japan have remained high, while such in the US and Europe (not to mention emerging markets) have steadily declined. This is the key reason why Japanese equities outperformed global markets in USD terms in 2015 and will likely do so again in 2016, as the earnings expectation divergence trend seems to be accelerating, so it is important to understand all the reasons for corporate earnings growth in Japan.

Fortunately, Japan has relatively minor commodity-producing exposure, so its corporate profits have performed much better than European or American corporate profits during the commodity bust of the last eighteen months, as mining and energy multinationals comprised a significant portion of corporate profits in the West. Meanwhile, the effects of low energy prices have pummeled energy-based economic zones in the US, as have low agriculture prices in its farm-belt.

Similarly, parts of Europe have been hurt by lower energy prices and the region has been hit by the effect of mutual economic sanctions with Russia. Corporate profits in Japan have also benefited from lower commodity input costs, and perhaps as much as any country, Japanese consumers have benefited from lower import prices of such (although partly offset by a weaker Yen). On the converse, recent media reports and analyst commentaries are suggesting the ECB’s QE program has failed to lift profits, although it seems clear profits would have been much worse without QE and that much of the profit problem was commodity price-related and, thus, out of the ECB’s control.

Importantly, yet completely separate from QE or other global fundamental factors, Japan has structurally improved its corporate governance. As my earlier writings have indicated, this improvement began ten years ago, but only became widely apparent in the last few years, and was augmented even further by Abenomics (along with the beneficial political stability that he has brought). The effect on corporate profits has been very strong, and expectations by the market for continued profit maximization has also boosted intermediate-term earnings estimates, which are extremely important for equity valuations. As corporate governance improvement has become mainstream, we expect this trend to continue developing this year, as there is yet much more to accomplish.

In any market, corporate profits should be the main driver of equity prices as long as valuations are fair, and on this front, as commodity prices remain low and corporate governance remains strong, Japan’s earnings and earnings expectations should outperform those in the West. Since equity valuations are also more attractive than in the West, these two factors strongly suggest that Japanese equities should outperform global equities in the next six months. Japan does have high operational gearing due to lower profit margins than the West, so if there is a global recession, the equity outlook vs. global markets is not as strong, but still relatively firm, in our view.

John Vail is Nikko AM’s Head of Global Macro Strategy and Asset Allocation.

Risk Budget: Spend It Wisely

  |   For  |  0 Comentarios

Presupuesto de riesgo: gasta con sabiduría
CC-BY-SA-2.0, FlickrPhoto: Scott Hudson. Risk Budget: Spend It Wisely

For those who budget, time is an asset. Wise spending decisions often take longer to bear fruit. Committing to a budget long-term could potentially lower one’s debt and improve their cash flow. Blow the budget with short-sighted spending decisions, however, and what might have been a good financial outcome turns undeniably less certain.

Similarly, an active manager’s risk budget—how and where they decide to “spend” or allocate risk —directly impacts their potential to outperform. In fact those spending decisions are a critical component of active risk management. In budgeting risk, an active manager essentially identifies, quantifies and sets their active risk allocations as efficiently as possible. The end goal is to maximize the potential reward for the amount of risk taken.

Just as in personal budgeting, there are tradeoffs to risk budgeting — deciding to spend in one place sacrifices the ability to spend in another. So those spending decisions must be meaningful — and purposeful.  For an active manager, that’s a matter of understanding the idiosyncratic risks of individual securities, seeing the potential upside and recognizing the potential downside. The idea is not to take unintended risks. 

What are some of the risk budgeting decisions an active manager might make? In more difficult markets, where active managers can play to their strengths, they might choose not to own the largest stocks, which, historically haven’t grown as fast through a market cycle. Or, an active manager might try to position away from some of the most expensive parts of the market, which have often become overextended in the days leading up to market peaks. They might also position away from the most volatile parts of the market, which typically haven’t performed as well through a full market cycle. In fact part of an active manager’s potential to outperform depends on their ability to mitigate the impact of volatility by reducing the downside risk at the security level. That’s why it’s so important to integrate risk management into the investment process, all the way down to the analyst level and in the evaluation of individual companies.

Much like personal budgeting, risk budgeting needs time to come to fruition. It’s not something that can be turned off or on but rather, a process that relies on discipline and a long-term, forward looking view. Active managers budget risk based on what they think could happen, not just on what has happened. But that’s really where spending wisely could have its greatest opportunity –sacrificing a little now to potentially get closer to what you might need further out.

James Swanson is MFS Chief Investment Strategist.

Did the Fed Make a Rate-Hike Mistake?

  |   For  |  0 Comentarios

Volatilidad en máximos: ¿Cometió un error la Fed al subir tipos en diciembre?
CC-BY-SA-2.0, FlickrPhoto: Sebastien Bertrand. Did the Fed Make a Rate-Hike Mistake?

Talk of the US Federal Reserve (Fed) having hiked too late in December is self-defeating and, at this stage, pointless. Decisions on whether the Fed made the right decision or not should be based on the information at the time; not hindsight.

The case for hiking in December was simple: the labour market was booming, the economy appeared to be approaching full-employment rapidly, and economic models say this eventually leads to higher inflation. So if the Fed wanted to be gradual in its hiking cycle to avoid having to cause a sharper slow-down later on, then it needed to start hiking sooner rather than later.

Reasonable people can disagree with this argument, pointing to the possibility of hidden slack in the labour market and our possibly flawed understanding of the inflationary process. But nothing that has happened since December should drastically alter which side of that argument one sides with. The one month of nasty market volatility we have seen should not fundamentally alter one’s assessment of the economy and so appropriate policy.

If anything the economy has broadly developed in 2016 as the Fed expected. While activity has weakened a little, the labour market has continued to look strong and there are tentative signs of wages finally picking up. Financial market volatility does not seem to be telling us anything worrying about the state of the economy. This should reassure the Fed and give pause to the critics.

Bizarrely there are even some critics who claim that hiking in December 2015 was a mistake, but that the Fed should have hiked in 2014. It is hard to make sense of these arguments. Unemployment was higher and the output gap bigger in 2014, so the case for easy policy was simply much stronger. The Fed does not have some ‘window of opportunity’ to hike, as if hiking in and of itself is the objective of policy. It hikes if, and only if, the economy needs it. Hiking in 2014 would have kept the economy weaker and ultimately caused rates to be lower in the future. The surest way of ensuring rates stay low for the longest time is to hike too early. As the European Central Bank knows only too well after it chased after inflationary apparitions by hiking in 2011.

If the Fed did make an error it was in painting themselves in a corner over hiking in December.

After signalling in early 2015 that they planned on hiking at some point that year, they felt obliged to follow through on this semi-promise. Had they failed to hike this would probably have undermined their communication credibility. But long-term credibility comes from ‘doing the right thing’ – being flexible enough to adjust to the situation and changing policy when the ‘facts change’ – as our economist friend Mr Keynes would have advocated.

It may be that this is what the Fed ends up doing in 2016.

While recent volatility does not suggest the 2015 hike was a mistake, it might mean that the Fed should change its plans for 2016. It is currently signalling that it will hike three to four times this year. This may no longer be appropriate. Recent market moves may not have been caused by economic weakness but it could cause economic weakness. Market weakness can create economic weakness that then justifies the market weakness. The Fed will probably want to push back on this by signalling a slightly easier path. But this is certainly not the same as saying the earlier hike was a mistake.

Luke Bartholomew is Fixed Income Strategist at Aberdeen AM.