Has Trump Re-set U.S.-China Relations?

  |   For  |  0 Comentarios

¿Trump cambió su sentir sobre las relaciones entre China y los EE.UU.?
Foto: G20. Has Trump Re-set U.S.-China Relations?

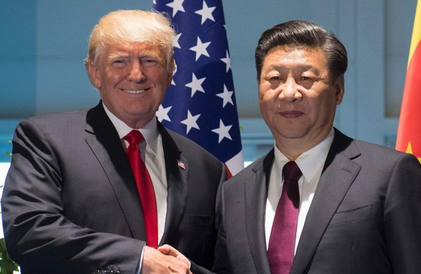
Following his G-20 meeting with Xi Jinping, Donald Trump went well beyond the trade truce I had expected, as he downplayed the national security tensions between the U.S. and China while describing the bilateral relationship as one of “strategic partners.”With that characterization of the relationship and his apparent decision to lift his administration’s recent ban on the sale of American technology to Huawei, Trump threw his national security team under the bus.

Returning to his transactional roots, Trump favored selling more goods to China over his advisers’ attempts to constrain the rise of that nation (and its leading telecom company). If the president sticks with this approach—which is not a sure thing—that would be positive for the future of the bilateral relationship and for the near-term health of Chinese consumer and corporate sentiment.

Partners rather than adversariesIn an article on our website last month, I wrote that “Far more than trade will be on the table when the two leaders next meet. . . In short, [Trump and Xi] will have to agree that rising competition between the two nations does not have to be a zero-sum game, and that it is cooperation and concessions, rather than confrontation, that will leave both sides better off.”

In his comments after meeting with Xi in Osaka, Trump seems to have opted for engagement over confrontation. When a reporter for Caixin, a Chinese financial magazine, asked if the two countries should view each other as strategic partners, competitors or enemies, Trump replied: “I think we’re going to be strategic partners. I think we can help each other.”

That was, for the moment, at least, a stark rejection of the more adversarial, “strategic competitor” approach that the president’s national security team has been advocating.Trump’s perspective was evident in his comments on two contentious issues: Huawei, a world leader in 5G technology and in mobile phone sales; and the status of Chinese students in the U.S.

“We’re letting them sell to Huawei”

The Trump administration recently placed Huawei on an “entity list,” limiting the company’s ability to purchase U.S. technology. But at Saturday’s press conference, Trump said he would roll back that restriction. “U.S. companies can sell their equipment to Huawei. I’m talking about equipment where there is no great national emergency problem with it. But the U.S. companies can sell their equipment. So we have a lot of great companies in Silicon Valley and based in different parts of the country, that make extremely complex equipment. We’re letting them sell to Huawei.”

The details of this decision are unclear, but Trump suggested that he may remove Huawei from the “entity list.” “We’re talking about that,” he said. “We have a meeting on that tomorrow or Tuesday.”
Trump then raised the case of another Chinese telecom company which had been, briefly, sanctioned by his administration. “I took ZTE off, if you remember. I was the one; I did that. That was a personal deal. And then President Xi called me. And he asked me for a personal favor, which I considered to be very important. . . And they paid us a billion-two. $1.2 billion.”

The president’s comments appear to undercut his administration’s earlier statements that Huawei presents a national security threat and should be denied access to American technology, and should also be blocked from selling 5G networking gear to U.S. allies.

“We want to have Chinese students come”

The director of the FBI recently suggested that many Chinese students in the U.S. are spies, and the State Department has made it more difficult for Chinese citizens to obtain student visas, but Trump took a different tack at his Osaka press conference. Apparently, Xi raised this issue with the president, who told reporters:

“Somebody was saying it was harder for a Chinese students to come in. And that’s something if it were—it [sic] somebody viewed it that way, I don’t. We want to have Chinese students come and use our great schools, our great universities. They’ve been great students and tremendous assets. But we did discuss it. It was brought up as a point, and I said that will be just like anybody else, just like any other nation.”

“A brilliant leader and a brilliant man”

Trump, who is often reluctant to praise those across the negotiating table, called Xi “a brilliant leader and a brilliant man.” Trump added, without explanation, that Xi is perhaps the greatest Chinese leader “in the last 200 years.”In the same press conference, Trump described Xi as “strong” and “tough . . . but he’s good. . . I have a tremendous relationship with President Xi.”Trade talks “right back on track”In his G-20 press conference, Trump described the bilateral trade talks as “right back on track.” He didn’t lift the tariffs already in place on Chinese goods, but postponed additional tariffs he had threatened to levy.

Taking the same transactional approach as with Huawei, Trump told reporters, “China has agreed that, during the negotiation, they will begin purchasing large amounts of agricultural product from our great Farmers.”Signaling, perhaps, a link in his mind between concluding a trade deal and his re-election prospects, the president said, “(But) in the end, the farmers are going to be the biggest beneficiary. But I’ve made up for the fact that China was, you know, targeting our farmers. . . The farmers could not be happier…”

The following day, in South Korea, Trump added another optimistic note about a trade deal:“President Xi and I had a fantastic meeting. It was a great meeting. We get along. We also have a really, really good relationship. And he wants to see something happen and so would I. And I think there’s a really good chance of that happening.”

Cautiously optimistic

I remain optimistic about prospects for a trade deal in the near future, because Trump seems to recognize that a trade war with China would damage the U.S. economy and equity markets, and thus his re-election prospects.

All signs are that Xi also continues to want to reach a deal. While tariffs are not a huge problem, as China is no longer an export-led economy, failure to conclude a deal would open up the risk that a full-blown trade war leads to restrictions on China’s access to American tech, everything from semiconductors to research collaboration. That would be a setback to China’s economic growth, which Xi wants to avoid.

The future beyond a trade deal is less clear, but after listening to Trump’s weekend comments, I am less pessimistic than I was a week ago about prospects for the broader bilateral relationship. We will soon see if the president turns his recent rhetoric into actions which promote engagement over containment.

In the meantime, Trump’s words are likely to be received positively by Chinese consumers and investors. Remember that real (inflation-adjusted) retail sales rose 6.4% in May, and the Shanghai Composite Index was up 19% during the first six months of the year. The business community, however, felt pressure from the tensions with the U.S., leading to weaker corporate investment and industrial output during the first five months of 2019. The June macro data will be out soon, while the impact of the Trump-Xi meeting will register over the coming months.

Column by Matthews Asia, written by Andy Rothman, Investment Strategist

Global Markets Seem to Have Priced In a July Cut

  |   For  |  0 Comentarios

Global Markets Seem to Have Priced In a July Cut
Foto: Fed CC0. Los mercados ya han anticipado un recorte en julio

Stocks rallied to all-time highs in June bolstered by hopes for progress in the global trade wars and in anticipation of a potential reduction in the Fed’s policy interest rate. At the June meeting, the FOMC signaled that it was prepared to cut rates this year stating that uncertainties have increased and “the Committee will closely monitor the implications of the incoming information…and will act as appropriate to sustain the expansion.” Global markets seem to have priced in a July cut.

Stocks finished June with the best gain for that month since 1955 to close an outstanding quarter and the best first half gain since 1997. Financial markets are now discounting a positive outcome of the trade talks between President Trump and Chinese President Xi Jinping at the G20 summit in Japan, which started on June 29.

On the deal front, a surge of M&A transactions and IPOs put the U.S. way ahead of Europe and Asia for the first half. The booming U.S stock market and relatively strong economy provided a solid backdrop for deal making activity. Activists lit the fuse in many cases as buy side catalysts versus their typical role of demanding that sellers get higher prices from acquirers. Antitrust push back created formidable obstacles to some deals such as Sprint Corp. / T Mobile and Spark Therapeutics / Roche.

Announced first half U.S. deal values jumped twenty percent from a year ago to a record $1.1 trillion, the first time to reach that level during those six months.

Prominent proposed U.S. mega deals – those over $10 billion – included the $121 billion merger of United Technologies’ aerospace division with defense contractor Raytheon, U.S. drug maker AbbVie’s $63 billion bid to acquire peer Allergan Plc and Occidental Petroleum’ $38 billion deal to buy Anadarko Petroleum.

We expect M&A activity to pick up for small and mid-sized companies during the second half of the year as strategic and private equity buyers take a closer look at the intrinsic values versus the market prices of these companies.

Column by Gabelli Funds, written by Michael Gabelli


To access our proprietary value investment methodology, and dedicated merger arbitrage portfolio we offer the following UCITS Funds in each discipline:

GAMCO MERGER ARBITRAGE

GAMCO Merger Arbitrage UCITS Fund, launched in October 2011, is an open-end fund incorporated in Luxembourg and compliant with UCITS regulation. The team, dedicated strategy, and record dates back to 1985. The objective of the GAMCO Merger Arbitrage Fund is to achieve long-term capital growth by investing primarily in announced equity merger and acquisition transactions while maintaining a diversified portfolio. The Fund utilizes a highly specialized investment approach designed principally to profit from the successful completion of proposed mergers, takeovers, tender offers, leveraged buyouts and other types of corporate reorganizations. Analyzes and continuously monitors each pending transaction for potential risk, including: regulatory, terms, financing, and shareholder approval.

Merger investments are a highly liquid, non-market correlated, proven and consistent alternative to traditional fixed income and equity securities. Merger returns are dependent on deal spreads. Deal spreads are a function of time, deal risk premium, and interest rates. Returns are thus correlated to interest rate changes over the medium term and not the broader equity market. The prospect of rising rates would imply higher returns on mergers as spreads widen to compensate arbitrageurs. As bond markets decline (interest rates rise), merger returns should improve as capital allocation decisions adjust to the changes in the costs of capital.

Broad Market volatility can lead to widening of spreads in merger positions, coupled with our well-researched merger portfolios, offer the potential for enhanced IRRs through dynamic position sizing. Daily price volatility fluctuations coupled with less proprietary capital (the Volcker rule) in the U.S. have contributed to improving merger spreads and thus, overall returns. Thus our fund is well positioned as a cash substitute or fixed income alternative.

Our objectives are to compound and preserve wealth over time, while remaining non-correlated to the broad global markets. We created our first dedicated merger fund 32 years ago. Since then, our merger performance has grown client assets at an annualized rate of  approximately 10.7% gross and 7.6% net since 1985. Today, we manage assets on behalf of institutional and high net worth clients globally in a variety of fund structures and mandates.

Class I USD – LU0687944552
Class I EUR – LU0687944396
Class A USD – LU0687943745
Class A EUR – LU0687943661
Class R USD – LU1453360825
Class R EUR – LU1453361476

GAMCO ALL CAP VALUE

The GAMCO All Cap Value UCITS Fund launched in May, 2015 utilizes Gabelli’s its proprietary PMV with a Catalyst™ investment methodology, which has been in place since 1977. The Fund seeks absolute returns through event driven value investing. Our methodology centers around fundamental, research-driven, value based investing with a focus on asset values, cash flows and identifiable catalysts to maximize returns independent of market direction. The fund draws on the experience of its global portfolio team and 35+ value research analysts.

GAMCO is an active, bottom-up, value investor, and seeks to achieve real capital appreciation (relative to inflation) over the long term regardless of market cycles. Our value-oriented stock selection process is based on the fundamental investment principles first articulated in 1934 by Graham and Dodd, the founders of modern security analysis, and further augmented by Mario Gabelli in 1977 with his introduction of the concepts of Private Market Value (PMV) with a Catalyst™ into equity analysis. PMV with a Catalyst™ is our unique research methodology that focuses on individual stock selection by identifying firms selling below intrinsic value with a reasonable probability of realizing their PMV’s which we define as the price a strategic or financial acquirer would be willing to pay for the entire enterprise.  The fundamental valuation factors utilized to evaluate securities prior to inclusion/exclusion into the portfolio, our research driven approach views fundamental analysis as a three pronged approach:  free cash flow (earnings before, interest, taxes, depreciation and amortization, or EBITDA, minus the capital expenditures necessary to grow/maintain the business); earnings per share trends; and private market value (PMV), which encompasses on and off balance sheet assets and liabilities. Our team arrives at a PMV valuation by a rigorous assessment of fundamentals from publicly available information and judgement gained from meeting management, covering all size companies globally and our comprehensive, accumulated knowledge of a variety of sectors. We then identify businesses for the portfolio possessing the proper margin of safety and research variables from our deep research universe.

Class I USD – LU1216601648
Class I EUR – LU1216601564
Class A USD – LU1216600913
Class A EUR – LU1216600673
Class R USD – LU1453359900
Class R EUR – LU1453360155

Disclaimer:
The information and any opinions have been obtained from or are based on sources believed to be reliable but accuracy cannot be guaranteed. No responsibility can be accepted for any consequential loss arising from the use of this information. The information is expressed at its date and is issued only to and directed only at those individuals who are permitted to receive such information in accordance with the applicable statutes. In some countries the distribution of this publication may be restricted. It is your responsibility to find out what those restrictions are and observe them.

Some of the statements in this presentation may contain or be based on forward looking statements, forecasts, estimates, projections, targets, or prognosis (“forward looking statements”), which reflect the manager’s current view of future events, economic developments and financial performance. Such forward looking statements are typically indicated by the use of words which express an estimate, expectation, belief, target or forecast. Such forward looking statements are based on an assessment of historical economic data, on the experience and current plans of the investment manager and/or certain advisors of the manager, and on the indicated sources. These forward looking statements contain no representation or warranty of whatever kind that such future events will occur or that they will occur as described herein, or that such results will be achieved by the fund or the investments of the fund, as the occurrence of these events and the results of the fund are subject to various risks and uncertainties. The actual portfolio, and thus results, of the fund may differ substantially from those assumed in the forward looking statements. The manager and its affiliates will not undertake to update or review the forward looking statements contained in this presentation, whether as result of new information or any future event or otherwise.


How Does Reg BI Affect the Cross-Border Private Wealth Business?

  |   For  |  0 Comentarios

¿Qué significa Reg BI para la banca privada transfronteriza?
Photo: Jimmy Baikovicius. How Does Reg BI Affect the Cross-Border Private Wealth Business?

Since 2010 and the passing of Dodd-Frank, the SEC and the industry have wrestled with how to minimize the inherent conflict between commission sales and a client’s right to obtain “disinterested” advice. Now, nearly a decade later, Regulation Best Interest is here and will fundamentally impact our industry in its attempt to mitigate that conflict. The question of whether a cross-border broker-dealer has acted in a client’s “best interest” will no longer be a matter of individual subjective discretion. Instead, that determination will be made subject to strict, disciplined guidelines by the SEC.

Reg BI will now require significant review of both broker-dealer and advisory offerings for an expanded level of conflict disclosure, and, in certain SEC-urged circumstances, mitigation or elimination of those conflicts. In addition, it will require a fundamentally new, disciplined and documented methodology for individual recommendations that has led some to openly question whether the commission model can survive under it.

Regulation Best Interest Generally

Under Reg BI, broker-dealers and investment advisers must provide layered disclosures and diligence at the firm, broker and product levels. Each of those obligations arise for broker- dealers at the time they “recommend” to a “retail customer” a securities transaction or investment strategy involving securities. Recommendations also extend to what type of account to open.

On its face, Reg BI’s mandate is not remarkable. It simply requires broker-dealers to act in the “best interest” of their retail customers when making recommendations about particular securities or investment strategies. The context of this “best interest” determination centers almost exclusively on prohibiting the broker-dealer from placing its financial interest ahead of the customer’s, and disclosing any information which may lead the customer to believe that the broker-dealer is not consciously or unconsciously “disinterested.” The difference is that now the SEC is requiring specific measures to document and confirm the methodology of reaching that determination.

Cross-Border Application

Because of the way the cross-border private wealth business delivers many of its services, satisfying those obligations could have a uniquely disadvantageous impact on our industry. Unlike the domestic investor, non-U.S. resident investment into U.S. accounts is often driven by non-economic factors including dollarization of currency risk, family security and risk, geographic diversification, and the international tax considerations tied to those. Further, non- U.S. resident investors often operate in languages other than English. Also, brokers who service non-U.S. resident clients often travel to meet their clients in countries that present additional layers of law and regulation and may legally constrain the in-country performance of certain service activities.

Smaller Shops

Many cross-border service providers are smaller broker-dealers or advisers that have limited offerings and platforms. In its mandate to fully disclose the scope and terms of the relationship with its customer, the SEC newly emphasizes the disclosure of any material limitations a broker-dealer may operate under, including limited licensing consequences, proprietary or limited product range, and limited strategy availability. Smaller firms may well bear a disproportionate amount of the compliance burden and cost in implementation. It is clear,
however, that the availability of only a limited range of product will not protect a firm or broker from Reg BI non-compliance.

An Expanded Duty of Care

While many cross-border brokers operate under FINRA Rule 2111 (suitability), Reg BI’s enhanced suitability requirements will force greater and deeper knowledge of a client’s investment profile —specifically, tax status — in order to formulate a compliant recommendation. The obligation not only requires “diligence, care and skill” in making disinterested recommendations, but will now require that the methodology used in considering alternatives, costs, and consequences of the recommendation be thoroughly documented. Those variables must then be analyzed in application to a particular customer’s investment profile before a compliant recommendation can be made. Importantly, a customer’s investment profile must include a documented analysis of the customer’s tax status and the impact of any recommendation under that status. Under this “show your work” methodology, the ability to minimize the importance of client tax status will be largely lost.

Broker Compensation

Because the SEC views certain bonuses as too pernicious to be merely disclosed or mitigated, benchmark and target-laden packages under which many now work, may need to be revised or eliminated. In a marked departure from its disclosure-oriented philosophy, the SEC has now determined that certain types of conflict are so harmful that only eliminating them will suffice. While some, like sales contests, and sales quotas, have largely been abandoned by a self-policing industry, the application of that elimination strategy to other modes of
compensation remains unclear. Accordingly, the viability of benchmark-laden revenue goals is now in substantial question.

Non-Economic Investment Considerations

At its core, Reg BI is heavily premised on “objectively verifiable” performance indicators that disregard some of the main drivers to cross-border investment—such as geographic diversity, dollarization of assets, privacy and security, and complex structures for tax and succession planning. While the SEC has also noted that these “highly personalized non-economic” drivers may also factor into the best interests inquiry, how those factors will be weighed remains unclear.

Document Delivery and Prospects

Reg BI is triggered when a recommendation is made. That trigger could well create obligations upon a broker regardless of whether the recipient has an account that may actually execute the trade. While much uncertainty remains as to when Reg BI applies, it is important to note that the SEC is urging heightened consideration in making recommendations to prospects.
“[A] broker-dealer should carefully consider the extent to which it can make a recommendation to prospective retail customers, including having gathered sufficient information that would enable them to comply with Regulation Best Interest… should the prospective retail customer use the recommendation.”

Conclusion

At first blush, Reg BI appears to be the SEC’s innocuous response to the mandates of Dodd-Frank. But when applied to the cross-border banking industry, Reg BI will significantly impact the ways that broker-dealers interact with their international customers. Many are questioning the viability of the brokerage model given the increased compliance costs. Others are advocating a limiting of recommended stocks or clients eligible for recommendations. All these options themselves would require conflict disclosure under Reg BI!

We will all look expectantly to how the industry responds.

Column by Sergio Alvarez-Mena, Partner, Financial Institutions Litigation and Regulation Practice, Jones Day Miami, and Lance Maynard, University of Miami School of Law (JD/MBA 2020)
 

Facebook: The New Central Bank?

  |   For  |  0 Comentarios

Facebook: ¿el nuevo banco central?
Pixabay CC0 Public DomainCourtesy photo. Facebook: The New Central Bank?

Facebook has become an essential part of our social, cultural, economic and political spheres. Now it is looking to become our new global payment system. This was the announcement that came last week from the Libra Association (led by Facebook) along with a whitepaper about the creation of a new cryptocurrency called Libra and its accompanying digital wallet, Calibra.

The first digital currency, Bitcoin, was followed by many others: Ethereum, Dodgecoin, Litecoin, Ripple, XEM, Dash, Monero, Petro, etc.  Apparently, we will now have one more as early as the first half of 2020. However, this is not going to be just “one more” as Libra looks more like a fiat currency than a cryptocurrency. In other words, with the gold standard consigned to the history books, along comes the all-powerful Facebook to create a digital currency backed by a basket of financial assets.

Facebook is not alone in this endeavour. Companies like Visa, Mastercard, PayPal, Spotify, eBay, Vodafone, Booking, Mercado Pago and Thrive Capital are among the 28 founding members of the Libra Association that will govern Libra. The goal is to reach 100 members before the official launch of the digital currency. Besides the sheer weight of the consortium of businesses backing the currency, if we add into the equation the 2.32 billion active users enjoyed by Facebook each month (one third of the world’s population), it is not hard to image the potential reach of this new cryptocurrency.

In many respects, the use of blockchain technology for Libra is quite different from the other digital currencies we know about today. Quite the opposite, in fact. The Libra whitepaper rejects the idea of anonymity and secrecy in transactions and the Libra Association has already confirmed its collaboration with financial regulators to prevent money laundering and tax avoidance.

A further crucial difference with Libra is the backing of a reserve of low volatility assets including bank deposits and short-term government debt in stable currencies like the dollar, euro, Swiss franc and yen. That said, we will need to have faith that the Libra Association will maintain these assets, record transactions and that Libra itself will be fungible, etc. Ultimately, this is the same faith we currently have in the central banks, except for a couple of important distinctions: Facebook is a private entity but it will hold some underlying assets, whereas central banks are public bodies but they do not hold assets that fully support currency issuance.

Of course, misgivings and controversies are already springing up regarding matters like data protection and the use of information in such a high-profile project. Let us not forget that Facebook possesses a vast archive of personal data from its users, about whom it knows practically everything. Many of us have not forgotten about the fines imposed on Facebook by the European Union for controversies like this and the scandal surrounding Cambridge Analytica, the consulting firm that unlawfully used information gathered from 87 million Facebook users.

Following the announcement of Libra’s creation, it is inevitable that the reflections that have been floating around for some time regarding cryptocurrencies come to the forefront once again. For example, questions are being asked about the implications for central banks and monetary policy in the event of the widespread use of a payment system like Libra, which employs blockchain technology although with a different objective to other digital currencies like Bitcoin. At first glance, it may look like an attempt to undermine the power of central banks. But curiously, as one analyst has already pointed out, in the context of a financial crisis, it could reinforce the impact of negative interest rates as it would eliminate the possibility of hoarding physical currency and other means of avoiding negative rates.

According to the whitepaper on the creation of Libra, it is “a simple global currency and financial infrastructure that empowers billions of people”. For now it is just a fledgling project, but it is certainly an interesting one.

Column by Meritxell Pons, Director of Asset Management at Beta Capital Wealth Management, Crèdit Andorrà Financial Group Research.


Regardless of the Outcome, Trade Wars are Now a Minus for Market Confidence

  |   For  |  0 Comentarios

Regardless of the Outcome, Trade Wars are Now a Minus for Market Confidence
Pixabay CC0 Public DomainFoto: Presidencia México. Independientemente del resultado, las guerras comerciales son ahora un punto negativo para la confianza del mercado

Stocks stumbled broadly with the worst loss for May since 2010 as U.S. trade negotiations hit the wall in China. President Trump jolted the markets at month end with an unexpected new threat of an escalating tariff aimed at giving the U.S. bargaining power to stop the rising flow of illegal immigration from Mexico. Regardless of the outcome, the trade wars are now a minus for market confidence.

Softening U.S. and world economic data and the tariff wars have also fueled concerns over a U.S. recession and have inverted the yield curve by driving the U.S Treasury ten year note yield down from 2.51 to 2.14 percent during May. Additionally, August West Texas Intermediate crude oil futures dropped sixteen percent during the month as U.S. production hit a record 12.3 million barrels a day.

The most recent FOMC minutes released in late May confirmed that the Fed expects the current slowdown in inflation to be transitory and that monetary policy is appropriate although an escalation in the trade war is an economic risk.  In a speech generally echoing the FOMC minutes on the morning of May 30, prior to Mr. Trump’s Mexico tariff tweet that night, Fed Vice Chairman Clarida said the Fed is prepared to adjust policy should the economic outlook deteriorate.

Some of the more prominent and complex pending deals in the merger arbitrage pipeline at the end of May include the $66 billion takeover of Celgene by Bristol-Myers Squibb, the $34 billion deal for Anadarko Petroleum by Occidental Petroleum and the $28 billion bid for Sprint by T-Mobile US Inc. On May 21 industrial products maker Crane Co (CR) announced it made a $45 all cash deal proposal for CIRCOR International (CIR). As long term owners of both companies, GAMCO’s proxy voting committee was surprised that CIRCOR’s Board had received the offer on April 30 with no subsequent disclosure until after the offer was first publicized by Crane. Since the end of May, we have continued to see strong deal activity with discussions surrounding United Technologies and Raytheon as well as Salesforce.com, Inc acquiring  Tableau Software, Inc.

We continue to scour the market for great companies to invest in and are focused on fundamental opportunities globally. The small and mid-cap space continues to be well valued and the long term upside, thanks to financial engineering, serves to be fruitful for investors.

Column by Gabelli Funds, written by Michael Gabelli


To access our proprietary value investment methodology, and dedicated merger arbitrage portfolio we offer the following UCITS Funds in each discipline:

GAMCO MERGER ARBITRAGE

GAMCO Merger Arbitrage UCITS Fund, launched in October 2011, is an open-end fund incorporated in Luxembourg and compliant with UCITS regulation. The team, dedicated strategy, and record dates back to 1985. The objective of the GAMCO Merger Arbitrage Fund is to achieve long-term capital growth by investing primarily in announced equity merger and acquisition transactions while maintaining a diversified portfolio. The Fund utilizes a highly specialized investment approach designed principally to profit from the successful completion of proposed mergers, takeovers, tender offers, leveraged buyouts and other types of corporate reorganizations. Analyzes and continuously monitors each pending transaction for potential risk, including: regulatory, terms, financing, and shareholder approval.

Merger investments are a highly liquid, non-market correlated, proven and consistent alternative to traditional fixed income and equity securities. Merger returns are dependent on deal spreads. Deal spreads are a function of time, deal risk premium, and interest rates. Returns are thus correlated to interest rate changes over the medium term and not the broader equity market. The prospect of rising rates would imply higher returns on mergers as spreads widen to compensate arbitrageurs. As bond markets decline (interest rates rise), merger returns should improve as capital allocation decisions adjust to the changes in the costs of capital.

Broad Market volatility can lead to widening of spreads in merger positions, coupled with our well-researched merger portfolios, offer the potential for enhanced IRRs through dynamic position sizing. Daily price volatility fluctuations coupled with less proprietary capital (the Volcker rule) in the U.S. have contributed to improving merger spreads and thus, overall returns. Thus our fund is well positioned as a cash substitute or fixed income alternative.

Our objectives are to compound and preserve wealth over time, while remaining non-correlated to the broad global markets. We created our first dedicated merger fund 32 years ago. Since then, our merger performance has grown client assets at an annualized rate of  approximately 10.7% gross and 7.6% net since 1985. Today, we manage assets on behalf of institutional and high net worth clients globally in a variety of fund structures and mandates.

Class I USD – LU0687944552
Class I EUR – LU0687944396
Class A USD – LU0687943745
Class A EUR – LU0687943661
Class R USD – LU1453360825
Class R EUR – LU1453361476

GAMCO ALL CAP VALUE

The GAMCO All Cap Value UCITS Fund launched in May, 2015 utilizes Gabelli’s its proprietary PMV with a Catalyst™ investment methodology, which has been in place since 1977. The Fund seeks absolute returns through event driven value investing. Our methodology centers around fundamental, research-driven, value based investing with a focus on asset values, cash flows and identifiable catalysts to maximize returns independent of market direction. The fund draws on the experience of its global portfolio team and 35+ value research analysts.

GAMCO is an active, bottom-up, value investor, and seeks to achieve real capital appreciation (relative to inflation) over the long term regardless of market cycles. Our value-oriented stock selection process is based on the fundamental investment principles first articulated in 1934 by Graham and Dodd, the founders of modern security analysis, and further augmented by Mario Gabelli in 1977 with his introduction of the concepts of Private Market Value (PMV) with a Catalyst™ into equity analysis. PMV with a Catalyst™ is our unique research methodology that focuses on individual stock selection by identifying firms selling below intrinsic value with a reasonable probability of realizing their PMV’s which we define as the price a strategic or financial acquirer would be willing to pay for the entire enterprise.  The fundamental valuation factors utilized to evaluate securities prior to inclusion/exclusion into the portfolio, our research driven approach views fundamental analysis as a three pronged approach:  free cash flow (earnings before, interest, taxes, depreciation and amortization, or EBITDA, minus the capital expenditures necessary to grow/maintain the business); earnings per share trends; and private market value (PMV), which encompasses on and off balance sheet assets and liabilities. Our team arrives at a PMV valuation by a rigorous assessment of fundamentals from publicly available information and judgement gained from meeting management, covering all size companies globally and our comprehensive, accumulated knowledge of a variety of sectors. We then identify businesses for the portfolio possessing the proper margin of safety and research variables from our deep research universe.

Class I USD – LU1216601648
Class I EUR – LU1216601564
Class A USD – LU1216600913
Class A EUR – LU1216600673
Class R USD – LU1453359900
Class R EUR – LU1453360155

Disclaimer:
The information and any opinions have been obtained from or are based on sources believed to be reliable but accuracy cannot be guaranteed. No responsibility can be accepted for any consequential loss arising from the use of this information. The information is expressed at its date and is issued only to and directed only at those individuals who are permitted to receive such information in accordance with the applicable statutes. In some countries the distribution of this publication may be restricted. It is your responsibility to find out what those restrictions are and observe them.

Some of the statements in this presentation may contain or be based on forward looking statements, forecasts, estimates, projections, targets, or prognosis (“forward looking statements”), which reflect the manager’s current view of future events, economic developments and financial performance. Such forward looking statements are typically indicated by the use of words which express an estimate, expectation, belief, target or forecast. Such forward looking statements are based on an assessment of historical economic data, on the experience and current plans of the investment manager and/or certain advisors of the manager, and on the indicated sources. These forward looking statements contain no representation or warranty of whatever kind that such future events will occur or that they will occur as described herein, or that such results will be achieved by the fund or the investments of the fund, as the occurrence of these events and the results of the fund are subject to various risks and uncertainties. The actual portfolio, and thus results, of the fund may differ substantially from those assumed in the forward looking statements. The manager and its affiliates will not undertake to update or review the forward looking statements contained in this presentation, whether as result of new information or any future event or otherwise.

Out of 129 CKDs, Only 15 Have had IIRs Above 10% so Far

  |   For  |  0 Comentarios

De un total de 129 CKDs, 15 logran TIRs superiores al 10% a la fecha
Pixabay CC0 Public DomainPhoto: PxHere CC0. Out of 129 CKDs, Only 15 Have had IIRs Above 10% so Far

The assets under management of the 10 AFOREs in Mexico amount to 186.771 million dollars at the end of April 2019, according to CONSAR. The AFOREs can invest 18% in CKDs and CERPIs as an average because each Siefore has his own limit.

The AFOREs at the end of April 2019, have investments in CKDS and CERPIs that represent 6.0% of their portfolio and have commitments that amount to approximately 5.5%, which establishes a potential market for investing 6.5% (10.272 billion dollars).

There is a total of 129 CKDs with a market value of 12.631 million dollars (md) according to the information prepared with data from the Mexican Stock Exchange and the issuers as of April 30.

Of these 129 CKDs 21 are CERPIs which have the characteristic that as of January 2018 they can invest 90% of the resources they manage abroad and 10% in Mexico. Currently the value of CERPIs is 791 million dollars of which 18 were issued in 2018 (81%); so far only 2 in 2019 and one in 2016.

Of the 21 CERPIS there are 11 fund of funds, 6 of Private equity, 3 of infrastructure and only 1 of real state that was born in 2016 before the changes of 2018.

Due to this change, 2018 is the year with the highest issuance of CKDs (38) and the highest amount committed in one year (6.869 million dollars).

As issuers of CERPIs we can find names like: Blackstone (4 CERPIs); KKR (3); BlackRock (2); General Atlantic (2); Lexington Partners (2); Spruceview (1); Partners Group (1); Glisco Discovery (1); Discovery Capital (1); Global Capital (1); Motal Engil (1); Mexico Infrastructure Partners (1) and MIRA Manager (1).

In the CKD universe, the sector with the largest amount committed is real state, which represents 25% of the total, followed by the infrastructure sector (19%); private capital (18%); fund of funds and energy (13% respectively); credit (11%) and the primary sector with 1% of the total issued.

The CKD performance is complex given that each one has its own characteristics (sector, economic cycle, year of issue, degree of advance of investments, leverage, among others), which makes comparisons difficult.
Despite this, the comparisons open the conversation with the GP about their performance in the period being compared.

The comparisons must be made with public information since it allows equal circumstances.

The way to calculate the performance of the CKDs with public information is calculating the IRR of each one (inflows and outflows of money to the CKD in the time of life that it has). In the 10 years of life that CKDs have, it is important to mention that between 2009 and 2012 they were pre-funded and since 2012 they were allowed to make capital calls, leaving the first CKD under this modality in July 2012. Homero Elizondo expert in CKDs estimated that the change reduced the cost between 200 and 500 basis point.

If all the CKDs are grouped by year of issue, the years that stand out are:

  • The 4 CKDs that came out in 2009 have a IRR of 9.8% in simple average and unweighted to the assets under management of each CKDs;
  • The 8 CKDs that came out in 2010 have an IRR of 7.6% on average;
  • The 4 CKDs of 2013 have a IRR of 7.3%;
  • The 19 CKDs of 2015 have an average IRR of 6.3% and
  • The 5 of 2011 have a IRR of 5.9% to mention the most profitable years of the last decade.

The results of the first three years of life of the CKDs is likely that are due to the fact that they are the ones that have lived the longest (between 7 and 10 years of life).
When reviewing by sectors you can see:

  • In the case of real state, the CKDs that were born between 2010 and 2013 bring average IRR per year between 6% and almost 9%.
  • For the infrastructure CKDs, two-digit average IRRs can be seen in at least three years: 2012 (21.9%), 2009 (11.5%) and 2015 (10.0%).
  • In the energy sector, although the average IRR of the 3 CKDs in 2015 is 10.3%, the case of the CKD that was issued in 2012 have a negative IRR of 57.8% stands out.
  • For private equity CKDs, there are two years with IRR slightly above 9% (2010 and 2012).
  • For credit CKDs, 2010 and 2012 stand out with IRRs of 8.0% and 10.0% respectively.
  • In the CKDs that are fund of funds, the highest TIR is 2012 with 4.3%.
  • In the primary sector where there are only 2 CKDs, only the 2008 issue is the one with an IRR of 4.4%.
  • Only 15 of a total of 129 CKDs, are identified with a greater IRR than 10% as of April 30.
  • In real state the two CKDs of Grupo Inmobiliario MEXIGS (IGSCK_11 and IGSCK_11-2) and FINSA (FINSACK_12) have a IRR higher of 10%.

Column by Arturo Hanono

The Coming Volatility in the Bond Kingdom

  |   For  |  0 Comentarios

La volatilidad que le espera al reino de los bonos
Pixabay CC0 Public Domain. The Coming Volatility in the Bond Kingdom

Certain distinguished voices are predicting the advent of significant volatility to come on American Interest Rates and erratic bond markets, within the next 12 months.

Following two possible outcomes, their observations are as follows. In the first scenario, the US economy slows down. This will force US monetary policy makers to cut short term rates. In addition, this reduced activity would imply less fiscal revenues and ballooning deficits, in turn driving up long term US rates.

In the second scenario, the US economy continues to do well. This could push US Central Bankers to consider increasing short term rates. This policy choice would lead to rising longer term interest rates as a consequence.

In both cases, American interest rate changes would translate into increasing volatility in the US bond markets. This observation misses one fundamental element: the current interest rates in the rest of the world.

The US has the status of being an economic locomotive for the world. The famous quote “when America sneezes, the world catches a cold” still remains pertinent today. Any US economic slowdown could lead to even weaker activity in other parts of the world such as Europe and Japan.

In an effort to sustain a modicum of economic growth, the policies of the Central Banks for these foreign regions could become even more accommodative. Their local Bond returns would then be so unattractive encouraging capital flows to immigrate to the American shores in search of positive yield returns.

In the case of the second scenario, rising US interest rates would make US Dollar Fixed Income returns more attractive than they are today. Local structural, political and demographic issues are unlikely to make European and Japanese Central Bankers change course from their current policy stance. Here to, one could envision further capital flows moving to the US, thereby mitigating the impact of any interest change to its bond market.

Up and coming erratic volatility in the American Fixed Income market is not at all certain. Foreign money flows moving from other parts of the world to the US could counter balance the negative impact of a change in its monetary policy while acting as a stabilizing investment force for its bond market.

What have European and Japanese investors left to lose? Negative to zero interest rates? Poor local economic activity? Over abundant and unproductive liquidity largely provided from their own local Central Banks? With positive yield returns, the US Fixed Income market remains the ‘cleanest dirty shirt in town’ for bond investors. 

Column by Steven Groslin, Executive Board Member and Portfolio Manager at ASG Capital
 

April Proved Possitive for Merger Arbitrage

  |   For  |  0 Comentarios

April Proved Possitive for Merger Arbitrage
Pixabay CC0 Public DomainFoto: GoranH. Abril fue un buen mes para el arbitraje de fusiones

Merger performance in April was bolstered by deals that progressed towards completion, as well as a new investment in Anadarko Petroleum that received an overbid shortly after announcing an agreement to be acquired by Chevron. More specifically:

  • On April 12, Anadarko Petroleum (APC-NYSE) agreed to be acquired by integrated energy company Chevron for $16.25 cash and 0.3869 shares of Chevron common stock per share of Anadarko, in a deal valued at about $48 billion. Anadarko is an explorer and producer of oil and natural gas globally, but with prized assets in U.S. shale formations. On April 24, shortly after announcing its tie-up with Chevron, Anadarko received an unsolicited bid to be acquired by Occidental Petroleum for $38 cash and 0.6094 shares of Occidental per share of Anadarko, which valued APC at about $55 billion. It was later revealed that Warren Buffett’s Berkshire Hathaway committed $10 billion to back Occidental’s bid to acquire Anadarko against Chevron, which has an enterprise value 5 times greater than Occidental. Anadarko is currently evaluating Occidental’s proposal. We benefited from our investment in Anadarko in April.
  • Versum Materials (VSM-NYSE), a manufacturer of chemicals and components that are used to make semiconductors, LED displays and other technological applications, agreed to be acquired by Merck KGaA under improved terms. In January 2019, Versum agreed to be acquired by Entegris in an all-stock transaction that valued Versum at about $37 per share. In late-February Merck made an unsolicited proposal to acquire Versum for $48 cash per share, which led to an agreement in April for Versum to be acquired by Merck for $53 cash per share, or about $6 billion. The transaction is expected to close in the second half of 2019.

Other notable events in April included:

  • Altaba (AABA-NASDAQ) announced its intention to liquidate and distribute cash and shares from its 11% ownership stake in Chinese online retailer Alibaba. Altaba is a closed-end investment fund that owns shares of Alibaba, cash and intellectual property and traces its roots to online services provider Yahoo! Inc. The company estimates total proceeds from liquidation are expected to be approximately $40 billion and the liquidation is subject to Altaba shareholder approval.
  • Goldcorp, Inc. (GG-NYSE), a gold-mining company with global operations, was acquired by Newmont Gold in an all-stock transaction valued at $12 billion. While the Goldcorp acquisition was pending, Newmont received an unsolicited proposal to be acquired by Barrick Gold, but Newmont and Barrick instead agreed to form a joint venture of the companies’ gold mining assets in Nevada.
  • Belmond Ltd. (BEL-NYSE), an owner and operator of luxury hotels worldwide, was acquired by luxury goods group LVMH Moet Hennessy Louis Vuitton for $25.00 cash per share, or about $4 billion.

Thanks to a robust market place, we expect ongoing deal activity will provide further prospects to generate returns uncorrelated to the market.

Column by Gabelli Funds, written by Michael Gabelli


To access our proprietary value investment methodology, and dedicated merger arbitrage portfolio we offer the following UCITS Funds in each discipline:

GAMCO MERGER ARBITRAGE

GAMCO Merger Arbitrage UCITS Fund, launched in October 2011, is an open-end fund incorporated in Luxembourg and compliant with UCITS regulation. The team, dedicated strategy, and record dates back to 1985. The objective of the GAMCO Merger Arbitrage Fund is to achieve long-term capital growth by investing primarily in announced equity merger and acquisition transactions while maintaining a diversified portfolio. The Fund utilizes a highly specialized investment approach designed principally to profit from the successful completion of proposed mergers, takeovers, tender offers, leveraged buyouts and other types of corporate reorganizations. Analyzes and continuously monitors each pending transaction for potential risk, including: regulatory, terms, financing, and shareholder approval.

Merger investments are a highly liquid, non-market correlated, proven and consistent alternative to traditional fixed income and equity securities. Merger returns are dependent on deal spreads. Deal spreads are a function of time, deal risk premium, and interest rates. Returns are thus correlated to interest rate changes over the medium term and not the broader equity market. The prospect of rising rates would imply higher returns on mergers as spreads widen to compensate arbitrageurs. As bond markets decline (interest rates rise), merger returns should improve as capital allocation decisions adjust to the changes in the costs of capital.

Broad Market volatility can lead to widening of spreads in merger positions, coupled with our well-researched merger portfolios, offer the potential for enhanced IRRs through dynamic position sizing. Daily price volatility fluctuations coupled with less proprietary capital (the Volcker rule) in the U.S. have contributed to improving merger spreads and thus, overall returns. Thus our fund is well positioned as a cash substitute or fixed income alternative.

Our objectives are to compound and preserve wealth over time, while remaining non-correlated to the broad global markets. We created our first dedicated merger fund 32 years ago. Since then, our merger performance has grown client assets at an annualized rate of  approximately 10.7% gross and 7.6% net since 1985. Today, we manage assets on behalf of institutional and high net worth clients globally in a variety of fund structures and mandates.

Class I USD – LU0687944552
Class I EUR – LU0687944396
Class A USD – LU0687943745
Class A EUR – LU0687943661
Class R USD – LU1453360825
Class R EUR – LU1453361476

GAMCO ALL CAP VALUE

The GAMCO All Cap Value UCITS Fund launched in May, 2015 utilizes Gabelli’s its proprietary PMV with a Catalyst™ investment methodology, which has been in place since 1977. The Fund seeks absolute returns through event driven value investing. Our methodology centers around fundamental, research-driven, value based investing with a focus on asset values, cash flows and identifiable catalysts to maximize returns independent of market direction. The fund draws on the experience of its global portfolio team and 35+ value research analysts.

GAMCO is an active, bottom-up, value investor, and seeks to achieve real capital appreciation (relative to inflation) over the long term regardless of market cycles. Our value-oriented stock selection process is based on the fundamental investment principles first articulated in 1934 by Graham and Dodd, the founders of modern security analysis, and further augmented by Mario Gabelli in 1977 with his introduction of the concepts of Private Market Value (PMV) with a Catalyst™ into equity analysis. PMV with a Catalyst™ is our unique research methodology that focuses on individual stock selection by identifying firms selling below intrinsic value with a reasonable probability of realizing their PMV’s which we define as the price a strategic or financial acquirer would be willing to pay for the entire enterprise.  The fundamental valuation factors utilized to evaluate securities prior to inclusion/exclusion into the portfolio, our research driven approach views fundamental analysis as a three pronged approach:  free cash flow (earnings before, interest, taxes, depreciation and amortization, or EBITDA, minus the capital expenditures necessary to grow/maintain the business); earnings per share trends; and private market value (PMV), which encompasses on and off balance sheet assets and liabilities. Our team arrives at a PMV valuation by a rigorous assessment of fundamentals from publicly available information and judgement gained from meeting management, covering all size companies globally and our comprehensive, accumulated knowledge of a variety of sectors. We then identify businesses for the portfolio possessing the proper margin of safety and research variables from our deep research universe.

Class I USD – LU1216601648
Class I EUR – LU1216601564
Class A USD – LU1216600913
Class A EUR – LU1216600673
Class R USD – LU1453359900
Class R EUR – LU1453360155

Disclaimer:
The information and any opinions have been obtained from or are based on sources believed to be reliable but accuracy cannot be guaranteed. No responsibility can be accepted for any consequential loss arising from the use of this information. The information is expressed at its date and is issued only to and directed only at those individuals who are permitted to receive such information in accordance with the applicable statutes. In some countries the distribution of this publication may be restricted. It is your responsibility to find out what those restrictions are and observe them.
 
Some of the statements in this presentation may contain or be based on forward looking statements, forecasts, estimates, projections, targets, or prognosis (“forward looking statements”), which reflect the manager’s current view of future events, economic developments and financial performance. Such forward looking statements are typically indicated by the use of words which express an estimate, expectation, belief, target or forecast. Such forward looking statements are based on an assessment of historical economic data, on the experience and current plans of the investment manager and/or certain advisors of the manager, and on the indicated sources. These forward looking statements contain no representation or warranty of whatever kind that such future events will occur or that they will occur as described herein, or that such results will be achieved by the fund or the investments of the fund, as the occurrence of these events and the results of the fund are subject to various risks and uncertainties. The actual portfolio, and thus results, of the fund may differ substantially from those assumed in the forward looking statements. The manager and its affiliates will not undertake to update or review the forward looking statements contained in this presentation, whether as result of new information or any future event or otherwise.

Is Europe Turning Japanese?

  |   For  |  0 Comentarios

¿Europa se está volviendo japonesa?
Foto cedida. Is Europe Turning Japanese?

In recent years, every now and then, parallels are made between Europe and Japan suggesting that Europe has entered a period of secular stagnation. Indeed, when the yield of the German Bund fell below 0% last quarter, some investors feared once again that Europe was turning Japanese.

Since 2008, growth has been tepid in Europe. Real private consumption is only 5% higher, equivalent to a yearly growth rate of 0.5% and investment is only now approaching the 2008 peak. The only bright spot has been net exports, which have doubled since then. In order to boost the economy, central banks reduce interest rates with the hope of spurring borrowing and therefore consumption. Twenty years ago, Japan first cut rates to 0% and since then, not only have official rates never exceeded 1% but they have hovered close to 0%. Growth, on the other hand, has generally remained anaemic. Likewise, the ECB has lowered official rates to 0% and, ten years after the crisis, any attempt at normalization has been kicked down the road. The fact is that low interest rates have had an indirect negative impact on the economy via the banking system. In both Europe and Japan, households and enterprises rely primarily on banks for their financing. This contrasts with the US where access to capital markets is more commonly used. The complicated situation of banks, due to falling net interest margins, stricter regulation, weak growth and political woes, has restrained both the old continent’s and Nippon’s banks from easily conceding loans.

Demographics is also a key similarity between both regions and probably the key structural problem explaining the low growth, interest rates and inflation. An ageing population and declining workforce has a direct impact on all these factors. As more and more people prepare for retirement, they tend to save more and, at the same time, labour supply diminishes, reducing growth and investment. Interest rates fall as savers chase fewer investment opportunities and in order to encourage borrowing. Another consequence is the negative impact on public deficits as governments are faced with increased healthcare costs for the elderly and less income from taxes.

Although Europe presents symptoms of the Japanese illness, there are a few relevant differences that point to a less critical situation in Europe and these differences may help it avoid a deflationary spiral. To begin with, in Europe, although inflation is still well below the ECB’s target of 2%, it is still positive, averaging 1% since 2012. This is a much better situation than in Japan where, despite 20 years of low interest rates and, more recently, a slew of unconventional policy tools, since 1999 inflation has been negative half the time. Japan is the only developed country where wages have fallen. Since 1996, inflation adjusted wages have dropped about 13%. The longer growth and inflation remain low, the more people are prone to save and postpone consumption. A decline in inflation also makes debt more burdensome and punishes borrowers. Of importance as well is the fact that the destruction of wealth in Japan after its twin real estate and financial asset bubbles burst was unique both in terms of scale and the impact on consumers. Counting the value of real estate and stock, Japan’s loss of wealth was equivalent to three years of its GDP. Moreover, the build-up of the debt overload in Japan before the crisis and its evolution thereafter was also very different to Europe. Credit growth in Japan reached 25% in 1990, whereas by 2008 in Europe, it was around 10%. Japan’s public debt-to-GDP has ballooned to almost 240% today, whereas in the euro zone, this ratio has dropped from 92% in 2014 to 86%.

That is not to say, however, that certain countries are not suffering a more complicated situation (for example, Italy with public debt at 130% of GDP). Finally, the ECB was also quicker to respond and address the problems.

Although Europe is suffering from low growth, interest rates and inflation, several important aspects are indicating a less dire situation than Japan. Monetary policy and other unconventional tools have, without a doubt, been necessary to support the economies of both regions, but their success in addressing the more structural problems has been limited. Going forward, Europe is still very dependent on external demand for growth and should perhaps try to attack its large current account surplus resulting from the northern bloc’s predisposition to save more that it invests. Combating Germany’s and other northern countries’ fiscal orthodoxy could give Europe another leg of growth and help it out of the doldrums.

Column by Jadwiga Kitovitz, Director of Multi-Asset Management and Institutional Clients of Crèdit Andorrà Group. Crèdit Andorrà Financial Group Research.

In Their First 10 Years, of a Total of 129, 86 CKDs Have Been Frequent Issuers

  |   For  |  0 Comentarios

Los CKDs en México, a 10 años de su lanzamiento: 86 han sido los emisores recurrentes de un total de 129
Photo: waway. In Their First 10 Years, of a Total of 129, 86 CKDs Have Been Frequent Issuers

This year will be 10 years of the first issuance of the private Investment vehicle (CKD) listed on the Mexican stock exchange. The CKD in Mexico have allowed the Afores to venture into the financing of various infrastructure projects, energy, real estate, mezzanine debt, as well as prívate equity.

The four CKDs that were born in 2009 are: RCO of Red de Carreteras de Occidente (infrastructure sector, ticker RCOCB_09 and with a current market value of 959 million dollars), Wamex (private equity, MIFMXCK_09 and with a current market value of 64 million dollars), Macquire (infrastructure, FIMMCK_09 and with a current market value of 303 million dollars) and Discovery Atlas (private equity, DAIVCK_16 and with a current market value of 66 million dollars), however, only Macquiere was issued at 10 years. that all others have a term between 20 and 29 years.

Among the eight CKDs that were born in 2010, only six will expire next year (2020), which will begin to close the first cycles of CKDs with net returns and that will be an important promotion mechanism. The history of the CKDs was carried out in 2008 with the issuance of the instrument structured by Santa Genoveva (primary sector, AGSACB_08 and with a current market value of $ 135 million dollars) issued at 20 years.

The CKD issued by Capital I Reserve (CI3CK_11 of real estate and a market value of 55 md) in 2011 is also close to expire.

The CKDs that came out between 2009 and 2012 (20 in total including Santa Genoveva) came out with the prefunded modality. The first CKD with capital calls was Northgate (AGCCK_12) in the private equity and fund of funds segment, which set the tone for starting issues with capital calls. It should be noted that the structure of capital calls with punitive dilution has been the most used methodology among subsequent CKDs.

Today there is a total of 129 CKDs with a market value of 12,644 million dollars and the capital commitments amount to 22,170 million dollars according to information prepared with data from the Mexican Stock Exchange and the issuers as of March 21.

The CKDs participate in 7 sectors, where three stand out in number of funds, market value and capital committed: real estate, infrastructure and private equity. The capital committed are greater than 4,000 million dollars in each of these sectors. The CKDs that are fund of funds, energy and credit (mezzanine debt), the capital committed amounts are between 2,000 and 3,000 million dollars. The primary sector being the smallest amount (294 million dollars).

Between 2016 and 2017 the offer of CKDs increased by 15 per year respectively and by 2018 the number increased 150% to place a total of 38 CKDs. Of these, 18 came under the format of International and Private Investment Vehicles (CERPIs). This significant change in number and amount placed was due to the change in regulation where the CONSAR allowed the Afores to invest up to 90% of the resources internationally and at least 10% in Mexico. Several of these issues are tailored suits to some Afores.

In terms of capital committed, 2018 was the year with the most committed resources (6,869 of 22,170 million dollars in total). In the first three months of 2019 there have been three new CKDs including two CERPIs (one more from Blackstone to complete 4 and the first from Spruceview Mexico) and one CKD (ACON).
Of the total 129 CKDs, 29 issuers can be identified that have jointly issued a total of 86 CKDs (almost three CKDs per issuer on average), so that 43 issuers have only one CKD in the market so far.

The 5 most important issuers in capital committed amount are:

  1. Infraestructura Mexico with 4 CKDs (the tickers are:  EXICK_14, EXICK_16-2, EXI2CK_17, EXICPI_18). Mexico Infrastructure Partners is an investment company specialized in investments in infrastructure and energy. It has capital calls of 288 million dollars and has capital commitments of 1,438 million dollars.
  2. Credit Suisse with 3 credit CKDs, that is, mezzanine debt (CSCK_12, CS2CK_15, CSMRTCK_17). It has capital calls of 479 million dollars and has capital commitments for 1,250 million dollars.
  3. Walton Streel Capital with 3 real estate CKDs (WSMXCK_13, WSMX2CK_16, WSMX2CK_18).  It has capital calls of 212 million dollars and has capital commitments for 1,061 million dollars.  In 2015 Walton also issued a CKD together with Finsa (FINWSCK_15) that has a market value of 243 million dollars.
  4. Artha Capital with 7 real estate CKDs (ARTHACK_10, ARTCK_13, ARTCK_13-2, ARTH4CK_15, ARTH4CK_15-2, ARTH5CK_17, ARTH4CK_18). It has capital calls of 321 million dollars and has capital commitments for 974 million dollars.
  5. BlackRock with 4 CKDs of which two of them are in CERPI format. The 4 CKDs participate in the energy sector, infraestructure and also have fund of funds (ICUADCK_10, ICUA2CK_14, BLKCPI_18, BLKAGPI_18D). It has capital calls of 298 million dollars and capital commitments for 921 million dollars

There is an initiative to allow private placement that, if authorized, would be highly likely to require secondary laws, which would take time to implement if applicable. This initiative is aimed to reducing issuer costs.

In what happens if it occurs, the maturities of the CKDs will start to have results that some will be good and another one not, given the nature of this type of investments where the important thing is diversification.

Column by Arturo Hanono