Private Investments Risk Part 1: “What is the Expected Return? “

  |   For  |  0 Comentarios

Screen Shot 2019-09-11 at 10
PxHere CC0. Riesgo en Inversiones Privadas, Parte 1: “Cuál es el rendimiento esperado?”

Potential investors always ask the all-important question – what is the expected return?  And if the answer is appealing in today’s low yield environment, the other important questions become less important to most investors.

However, the smartest investors follow up with the most important question – how do you make that return?  The answer is often a multi-faceted one and should inform of the investment decisions.  Is the return driven by excessive use of leverage, to make up for the high auction price paid for the company?  Is the return driven by a multiple expansion assumption, which late in an economic cycle is not a solid bet?  Is the return driven by the hope of an IPO with a too-lofty expected valuation?  Or is the return driven by genuine value creation: company building, exploiting an inefficient market, not paying high entry prices, using truly conservative assumptions, applying unwavering operational discipline, and in some cases, very responsible use of low cost, fixed rate leverage which under no circumstances can implode the company?

Private investors demand quality and most demand a track record, but how deeply do they look beyond the brand name of the firm and the expected return numbers presented in the marketing materials?  Do they perform a multi-dimensional attribution analysis?  Do they reference the partners to understand if they truly led the value creation process?  Do they deeply reference the sourcing process to understand if it was and will be sustainable and repeatable, or did they just get lucky?  Do they meet with the teams and take the time to understand how specifically they add value?  Is due diligence completed only by reading documents in the data room, or is there more that is done beyond the customary 2-4 week process most investors have?

Deep down in our hearts we all know what the right answers are to these important questions and we also know it is truly difficult to find those private fund strategies that truly do things the right way, without cutting corners, and do not take excessive risk to deliver a promised return.  We just have to find them.  And they do exist.

These fund managers may not visit you with their polished sales forces and menu of funds that they will make available to you.  They may not send their founders on their private jets to dine with you and make you feel special with the expectation that you will invest.  They may not even have a name you recognize.  And they may not know who you are because the only thing they are focused on is their investment portfolio.

To find the lower risk, appealing return strategies, we must first ask the hard questions and eliminate the strategies that, by their actions, increase risk instead of mitigating it.  Then we must find the inefficient sectors and sub sectors, the dislocated markets that will depend on private capital to thrive.  If successful, we must then identify and vet the best and most experienced managers within those sub sectors to make certain we understand how they create value, how they avoid risk, and what they do when things go wrong.  Only after we know these things, can we entrust our own and our clients’ AUMs to their stewardship.  There is a better way to invest in risk mitigated private investments.  The process is not easy, but well worth it in the long run.   

Column by Alex Gregory

4 AFOREs Are Among the 300 Largest Pension Funds

  |   For  |  0 Comentarios

Screen Shot 2019-09-09 at 8
Foto: Pixabay. Gaby SUBIDO =Cuatro afores se ubican entre los 300 fondos de pensiones más grandes del mundo

The world’s 300 largest pension funds reached 18 trillion dollars according to The World´s Largest Pension Funds published by Thinking Ahead Institute / Willis Towers Watson published on September 2 with information at the end of 2018.

Among the 300 largest pension funds are 4 of the 10 AFOREs in Mexico. These 4 add up to 128,579 million dollars and together they would occupy the 22nd place. The Government Pension Investment of Japan occupies the first place (since 2002) with 1,374,499 million dollars in assets under management. The United States has 141 funds among the top 300.

In order to see one more AFORE as Principal, PensiónISSSTE or Coppel who has more than 12,000 million dollars in assets under management respectively and are in the following three positions in size (places 5, 6 and 7 respectively in Mexico), they would have to approach to 14,777 million dollars in assets under management of Los Angeles Water & Power pension fund that occupies position 300.

The 4 Mexican AFOREs at least increased 15 places between 2017 and 2018 when comparing the new report with respect to the previous one that includes information at the end of 2017.

Afores

AFORE XXI Banorte, which is the largest in Mexico, is in the 102nd position with 41,133 million dollars in assets under management. Between 2017 and 2018, it advanced 16 places by increasing 3,300 million dollars, equivalent to a growth of 8.7%, so that it could be seen among the top 100 next year.

AFORE CitiBanamex, the second largest, is in position 138 with 33,143 million dollars in assets under management. It rose 19 places and grew at a rate of 9.0% between 2017 and 2018.

The growth of AFORE Profuturo GNP of 13.9%, closed the difference with respect to AFORE Sura who is in position 171 with 27,156 million dollars in assets under management while AFORE Profuturo GNP is in position 172 with only a difference of 9 million dollars, that maintaining this dynamism could overcome Sura at the end of this year.

The average compound annual growth rate (CAGR) was 10.88% in the last 5 years (2013-2018) for the Mexican market expressed in local currency, while this same data expressed in dollars was 2.24%.

It is interesting to note that the composition of the portfolio of the 300 largest pension funds has 44.5% in equity, 37.2% in bonds and 18.3% in alternative investments and cash on average. In the case of Mexico, the weighted average for the 10 AFOREs is below these percentages, representing 17.3% in equity (local and global) and in alternatives 8.8% according to CONSAR at the close of August. In the case of debt, the percentage is 73.9% (government, corporates and global bonds).

Column by Arturo Hanono


Downside Risks Can Only be Minimized and Not Eliminated As Major Central Banks’ Policies Leave Little Room for Further Stimulus

  |   For  |  0 Comentarios

Screen Shot 2019-09-05 at 8
Walter Ellem / Pexels CC0. Dowside Risks Can Only be Minimized and Not Eliminated As Major Central Banks’ Policies Leave Little Room for Further Stimulus

Stocks dropped sharply during early August following the first U.S. Federal Reserve rate cut in ten years, setting the low for the month on August 5.  For the remainder of the month prices whipsawed irregularly higher in reaction to headlines and events related to the global trade war, economic releases, corporate deals and earnings, and falling world interest rates, ending the month with a loss.

The China vs U.S. tariff dispute has spiralled into an economic trade war and its duration and outcome are unpredictable. Rapid currency movements further complicate the dynamics for orderly corporate earnings progressions as well as the efficient procurement of global resources and supplies.  Brexit is a wild card.

Notwithstanding the White House political tactics and decision making, Fed Chairman Powell made it clear at Jackson Hole that the FOMC will reduce rates to ‘insure’ downside risks if conditions deteriorate and U.S. growth falters. But these risks can only be minimized and not eliminated as major central banks’ ongoing negative interest rate policies leave little room for further rate stimulus.

A merger and acquisition arbitrage investment strategy with its absolute return focus makes a good choice to complement portfolios.

Prominent proposed but complex mega deals – over $10 billion – in the pipeline (target / acquirer) at the end of August included Celgene / Bristol-Myers Squibb, Sprint Corp / T-Mobile US, and Viacom / CBS. In the $5-10 billion range, Cypress Semiconductor / Infineon Technologies and in the under $5 billion bracket, Tribune Media / Nexstar Media, and Cray / Hewlett Packard Enterprise. We continue to see momentum in M&A market with overall business and investment trends still in a wait and see mode.

Column by Gabelli Funds, written by Michael Gabelli

To access our proprietary value investment methodology, and dedicated merger arbitrage portfolio we offer the following UCITS Funds in each discipline:

GAMCO MERGER ARBITRAGE

GAMCO Merger Arbitrage UCITS Fund, launched in October 2011, is an open-end fund incorporated in Luxembourg and compliant with UCITS regulation. The team, dedicated strategy, and record dates back to 1985. The objective of the GAMCO Merger Arbitrage Fund is to achieve long-term capital growth by investing primarily in announced equity merger and acquisition transactions while maintaining a diversified portfolio. The Fund utilizes a highly specialized investment approach designed principally to profit from the successful completion of proposed mergers, takeovers, tender offers, leveraged buyouts and other types of corporate reorganizations. Analyzes and continuously monitors each pending transaction for potential risk, including: regulatory, terms, financing, and shareholder approval.

Merger investments are a highly liquid, non-market correlated, proven and consistent alternative to traditional fixed income and equity securities. Merger returns are dependent on deal spreads. Deal spreads are a function of time, deal risk premium, and interest rates. Returns are thus correlated to interest rate changes over the medium term and not the broader equity market. The prospect of rising rates would imply higher returns on mergers as spreads widen to compensate arbitrageurs. As bond markets decline (interest rates rise), merger returns should improve as capital allocation decisions adjust to the changes in the costs of capital.

Broad Market volatility can lead to widening of spreads in merger positions, coupled with our well-researched merger portfolios, offer the potential for enhanced IRRs through dynamic position sizing. Daily price volatility fluctuations coupled with less proprietary capital (the Volcker rule) in the U.S. have contributed to improving merger spreads and thus, overall returns. Thus our fund is well positioned as a cash substitute or fixed income alternative.

Our objectives are to compound and preserve wealth over time, while remaining non-correlated to the broad global markets. We created our first dedicated merger fund 32 years ago. Since then, our merger performance has grown client assets at an annualized rate of  approximately 10.7% gross and 7.6% net since 1985. Today, we manage assets on behalf of institutional and high net worth clients globally in a variety of fund structures and mandates.

Class I USD – LU0687944552
Class I EUR – LU0687944396
Class A USD – LU0687943745
Class A EUR – LU0687943661
Class R USD – LU1453360825
Class R EUR – LU1453361476

GAMCO ALL CAP VALUE

The GAMCO All Cap Value UCITS Fund launched in May, 2015 utilizes Gabelli’s its proprietary PMV with a Catalyst™ investment methodology, which has been in place since 1977. The Fund seeks absolute returns through event driven value investing. Our methodology centers around fundamental, research-driven, value based investing with a focus on asset values, cash flows and identifiable catalysts to maximize returns independent of market direction. The fund draws on the experience of its global portfolio team and 35+ value research analysts.

GAMCO is an active, bottom-up, value investor, and seeks to achieve real capital appreciation (relative to inflation) over the long term regardless of market cycles. Our value-oriented stock selection process is based on the fundamental investment principles first articulated in 1934 by Graham and Dodd, the founders of modern security analysis, and further augmented by Mario Gabelli in 1977 with his introduction of the concepts of Private Market Value (PMV) with a Catalyst™ into equity analysis. PMV with a Catalyst™ is our unique research methodology that focuses on individual stock selection by identifying firms selling below intrinsic value with a reasonable probability of realizing their PMV’s which we define as the price a strategic or financial acquirer would be willing to pay for the entire enterprise.  The fundamental valuation factors utilized to evaluate securities prior to inclusion/exclusion into the portfolio, our research driven approach views fundamental analysis as a three pronged approach:  free cash flow (earnings before, interest, taxes, depreciation and amortization, or EBITDA, minus the capital expenditures necessary to grow/maintain the business); earnings per share trends; and private market value (PMV), which encompasses on and off balance sheet assets and liabilities. Our team arrives at a PMV valuation by a rigorous assessment of fundamentals from publicly available information and judgement gained from meeting management, covering all size companies globally and our comprehensive, accumulated knowledge of a variety of sectors. We then identify businesses for the portfolio possessing the proper margin of safety and research variables from our deep research universe.

Class I USD – LU1216601648
Class I EUR – LU1216601564
Class A USD – LU1216600913
Class A EUR – LU1216600673
Class R USD – LU1453359900
Class R EUR – LU1453360155

Disclaimer:
The information and any opinions have been obtained from or are based on sources believed to be reliable but accuracy cannot be guaranteed. No responsibility can be accepted for any consequential loss arising from the use of this information. The information is expressed at its date and is issued only to and directed only at those individuals who are permitted to receive such information in accordance with the applicable statutes. In some countries the distribution of this publication may be restricted. It is your responsibility to find out what those restrictions are and observe them.

Some of the statements in this presentation may contain or be based on forward looking statements, forecasts, estimates, projections, targets, or prognosis (“forward looking statements”), which reflect the manager’s current view of future events, economic developments and financial performance. Such forward looking statements are typically indicated by the use of words which express an estimate, expectation, belief, target or forecast. Such forward looking statements are based on an assessment of historical economic data, on the experience and current plans of the investment manager and/or certain advisors of the manager, and on the indicated sources. These forward looking statements contain no representation or warranty of whatever kind that such future events will occur or that they will occur as described herein, or that such results will be achieved by the fund or the investments of the fund, as the occurrence of these events and the results of the fund are subject to various risks and uncertainties. The actual portfolio, and thus results, of the fund may differ substantially from those assumed in the forward looking statements. The manager and its affiliates will not undertake to update or review the forward looking statements contained in this presentation, whether as result of new information or any future event or otherwise.

Let’s Change The Rulebook!

  |   For  |  0 Comentarios

¡Cambiemos el reglamento!
Pixabay CC0 Public Domain. ¡Cambiemos el reglamento!

Many countries came to support their domestic commercial banks during the meltdown of 2008. Following these ‘bail-outs’, the United States and Europe decided to review the banking legislation. They sought to eliminate the excesses of the past, considered to be at the root of this financial demise.

Certain activities were stopped and others reduced, under the watchful eye of regulators in charge of implementing these new rules. On top of this, the banking industry was asked to reinforce its capital footprint. The declared objective was to avoid soliciting any future taxpayer money for the next crisis.  

The overall cost of these interventions was very high. The governments concerned saw their national debt rise significantly. In some cases, this even led to the implementation of austerity policies. Commercial banks tried desperately to comply with the new rules imposed on them. Some even shied away from private sector lending, preferring to fund the public sector (now heavily indebted).

Sovereign public debt is considered less risky for banks under their investment regulation. The result has been weak economic activity in some areas (sub-potential growth) while in others it has been anemic. Faced with slow growth, world Central Banks have resorted to unconventional accommodating monetary mechanisms in the hope of jump-starting these ailing economies.

With fragile economic activity, a policy of low interest rates and higher new capital requirements to pay for, margins on traditional activity has been insufficient, at times, to cover bank financial needs. To some extent, technology has counterbalanced this phenomenon.

Many larger players have heavily invested and successfully improved their operational efficiency, underpinning their bottom line profitability and compensating the weakness in their top line revenue growth. In spite of this, the financial situation of banks remains precarious. Their activity depends on the underlying economy in which these entities operate.

In this context, American banks have sought to push for some changes to the new rulebook. They have focused their attention on the ‘Volcker rules’ considered to be too constraining for their financial market activity (the Volcker rules essentially cover market making and prop-trading restrictions). For one who understands the value of rising financial markets, Mr Trump has been open to entertaining this request. As he sees it, stronger and more profitable banks combined with higher markets could only add to the country’s growth prospects.

The political debate is now open for an adjustment of these rules. Once in place, American Banks will be able to boast of a triple competitive advantage: a resilient economy in which they operate, (the United States is doing relatively better than its European and Japanese counterparts), healthy lending margins supported by positive interest rates (still), and now potentially watered down rules compared to those of their direct foreign competitors.

When ‘tweeking’ the rulebook, the challenge for the authorities is to avoid a return of the excesses of the past. Since 2008, the policy of self-regulation supported by Mr Greenspan and Mr Bernanke has been dismantled. Today, the US regulator has the capacity to find an appropriate balance to undertake such reforms. It has a full set of legal tools at its disposal, which was not the case ten years ago.

Column by Ygal Cohen, President, CEO, and Founding Partner of ASG Capital

The Most Popular CERPIs are of Funds of Funds; Amongst CKDs, Real Estate Dominates

  |   For  |  0 Comentarios

El sector de fondo de fondos domina en los CERPIs, mientras que en los CKDs los de bienes raíces
Quentin Ecrepont / Pexels CC0. El sector de fondo de fondos domina en los CERPIs, mientras que en los CKDs los de bienes raíces

The market value of the 111 CKDs and 24 CERPIs in circulation ended July at 13.369 billion dollars and capital calls to be made acount for 11.354 billion dollars. 80% of resources are concentrated by CKDS and 20% by CERPIs.

Although the rise of CERPIs is just over one year old, despite its youth, it is already possible to observe a specialization and tendency in each of the instruments where CKDs have leaned towards the real estate sector (29% share of market in committed amount), while CERPIs by the fund of funds sector (57%). Curiously, in CKDs the fund of funds sector the offer is low (5%), while in CERPIs the offer of real estate alternatives is also low (4%).

The Most Popular CERPIs are of Funds of Funds; Amongst CKDs, Real Estate Dominates

It could be said that the Mexican institutional investor has so far preferred to invest in real estate in Mexico through CKDs than to invest in real estate internationally via CERPIs; while international investments in fund of funds call it more attention than in Mexico. It is important to mention that CKDs are private equity investments that are made exclusively in Mexico, while CERPIs investments 90% are made internationally and the rest in Mexico (10%).

In the private equity sector, there is also a specialization since while in the CERPIs it represents a 26% market share in committed amount, being the second most important sector; in the CKD market it reaches 15%, being the third most important sector.

A less concentrated market share can be seen in term of resources committed by sector in the CKDs, as is the case in CERPIs. In CKDs 4 sectors represent 80% (real estate 29%, infrastructure 21%, private equity and energy 15% each), while in the case of CERPIs only two sectors have 83% (fund of funds 57% and private equity 26%).

In the 10 years that the CKDs have been, it can be seen how there are years in which the offer is skewed towards a specific sector. For the real estate sector in 2018, the greatest placement of resources was achieved by committing 1.823 (31%) of the 5.911 million dollars of the sector. For the infrastructure sector, commitments were reached for 1.222 in 2015 (27%) of the 4.469 million dollars the market is worth. For energy it was 2014 (28% of the committed resources of the sector) and for credit it was 2015 (34%).

Hanono

Between January and July 2019, a total of 4 new CKDs and 5 new CERPIs have been seen that add commitments for 1.707 million dollars, of which 79% of the resources have been for CERPIs dominating the fund of funds raising. As for CKDs, preference for the real estate and infrastructure sector prevails.

Column by Arturo Hanono

The Risks of a Trade War/Rate Cut Spiral Are Rising

  |   For  |  0 Comentarios

The Risks of a Trade War/Rate Cut Spiral Are Rising
Pixabay CC0 Public DomainFoto: MaxPixel CC0. Los riesgos de una espiral de reducción de tasas están aumentando

Stocks closed at all-time highs on eight days during July to end the month with a gain despite a broad last day surprise sell off during Chairman Powell’s post FOMC statement press conference. The Fed cut its policy rate by 25 basis points.  Stocks headed down when he characterized this reduction as a ‘mid-cycle policy adjustment’ but rallied later when he said this cycle may not be ‘just one’ cut.

The Fed made it clear that it will reduce rates again to ‘insure’ downside risks if global economic growth falters and/or the trade war escalates. Stocks dropped sharply on August 1, after President Trump announced a new 10 percent tariff on $300 billion of Chinese imports. The risks of a trade war/rate cut spiral are rising.

Up to this point, the consumer driven U.S. economy and corporate profits have done relatively well. On July 30, the Commerce Department reported that May wages and salaries were revised to up 5.3% y/y, a large incremental increase of about $230 billion with June up 5.5%, the savings rate at 8.1% and the PCE deflator at 1.4% according to ISI.  Bottom line – real wages and salaries up 4.1%.

Additionally, with a major global central bank easing cycle now under way, the U.S. Fed’s balance sheet is likely to increase about $9 billion a month, and in combination with the ECB and BOJ, at an annualized rate of about $700 billion.

We continue to expect M&A activity to pick up for small and mid-sized companies during the second half of the year as lower rates get strategic and private equity buyers to take a closer look at the intrinsic values versus the market prices of these companies. We continue to keep our eye on the upcoming election in the U.S. and the potential effects on the market.

Column by Gabelli Funds, written by Michael Gabelli


To access our proprietary value investment methodology, and dedicated merger arbitrage portfolio we offer the following UCITS Funds in each discipline:

GAMCO MERGER ARBITRAGE

GAMCO Merger Arbitrage UCITS Fund, launched in October 2011, is an open-end fund incorporated in Luxembourg and compliant with UCITS regulation. The team, dedicated strategy, and record dates back to 1985. The objective of the GAMCO Merger Arbitrage Fund is to achieve long-term capital growth by investing primarily in announced equity merger and acquisition transactions while maintaining a diversified portfolio. The Fund utilizes a highly specialized investment approach designed principally to profit from the successful completion of proposed mergers, takeovers, tender offers, leveraged buyouts and other types of corporate reorganizations. Analyzes and continuously monitors each pending transaction for potential risk, including: regulatory, terms, financing, and shareholder approval.

Merger investments are a highly liquid, non-market correlated, proven and consistent alternative to traditional fixed income and equity securities. Merger returns are dependent on deal spreads. Deal spreads are a function of time, deal risk premium, and interest rates. Returns are thus correlated to interest rate changes over the medium term and not the broader equity market. The prospect of rising rates would imply higher returns on mergers as spreads widen to compensate arbitrageurs. As bond markets decline (interest rates rise), merger returns should improve as capital allocation decisions adjust to the changes in the costs of capital.

Broad Market volatility can lead to widening of spreads in merger positions, coupled with our well-researched merger portfolios, offer the potential for enhanced IRRs through dynamic position sizing. Daily price volatility fluctuations coupled with less proprietary capital (the Volcker rule) in the U.S. have contributed to improving merger spreads and thus, overall returns. Thus our fund is well positioned as a cash substitute or fixed income alternative.

Our objectives are to compound and preserve wealth over time, while remaining non-correlated to the broad global markets. We created our first dedicated merger fund 32 years ago. Since then, our merger performance has grown client assets at an annualized rate of  approximately 10.7% gross and 7.6% net since 1985. Today, we manage assets on behalf of institutional and high net worth clients globally in a variety of fund structures and mandates.

Class I USD – LU0687944552
Class I EUR – LU0687944396
Class A USD – LU0687943745
Class A EUR – LU0687943661
Class R USD – LU1453360825
Class R EUR – LU1453361476

GAMCO ALL CAP VALUE

The GAMCO All Cap Value UCITS Fund launched in May, 2015 utilizes Gabelli’s its proprietary PMV with a Catalyst™ investment methodology, which has been in place since 1977. The Fund seeks absolute returns through event driven value investing. Our methodology centers around fundamental, research-driven, value based investing with a focus on asset values, cash flows and identifiable catalysts to maximize returns independent of market direction. The fund draws on the experience of its global portfolio team and 35+ value research analysts.

GAMCO is an active, bottom-up, value investor, and seeks to achieve real capital appreciation (relative to inflation) over the long term regardless of market cycles. Our value-oriented stock selection process is based on the fundamental investment principles first articulated in 1934 by Graham and Dodd, the founders of modern security analysis, and further augmented by Mario Gabelli in 1977 with his introduction of the concepts of Private Market Value (PMV) with a Catalyst™ into equity analysis. PMV with a Catalyst™ is our unique research methodology that focuses on individual stock selection by identifying firms selling below intrinsic value with a reasonable probability of realizing their PMV’s which we define as the price a strategic or financial acquirer would be willing to pay for the entire enterprise.  The fundamental valuation factors utilized to evaluate securities prior to inclusion/exclusion into the portfolio, our research driven approach views fundamental analysis as a three pronged approach:  free cash flow (earnings before, interest, taxes, depreciation and amortization, or EBITDA, minus the capital expenditures necessary to grow/maintain the business); earnings per share trends; and private market value (PMV), which encompasses on and off balance sheet assets and liabilities. Our team arrives at a PMV valuation by a rigorous assessment of fundamentals from publicly available information and judgement gained from meeting management, covering all size companies globally and our comprehensive, accumulated knowledge of a variety of sectors. We then identify businesses for the portfolio possessing the proper margin of safety and research variables from our deep research universe.

Class I USD – LU1216601648
Class I EUR – LU1216601564
Class A USD – LU1216600913
Class A EUR – LU1216600673
Class R USD – LU1453359900
Class R EUR – LU1453360155

Disclaimer:
The information and any opinions have been obtained from or are based on sources believed to be reliable but accuracy cannot be guaranteed. No responsibility can be accepted for any consequential loss arising from the use of this information. The information is expressed at its date and is issued only to and directed only at those individuals who are permitted to receive such information in accordance with the applicable statutes. In some countries the distribution of this publication may be restricted. It is your responsibility to find out what those restrictions are and observe them.

Some of the statements in this presentation may contain or be based on forward looking statements, forecasts, estimates, projections, targets, or prognosis (“forward looking statements”), which reflect the manager’s current view of future events, economic developments and financial performance. Such forward looking statements are typically indicated by the use of words which express an estimate, expectation, belief, target or forecast. Such forward looking statements are based on an assessment of historical economic data, on the experience and current plans of the investment manager and/or certain advisors of the manager, and on the indicated sources. These forward looking statements contain no representation or warranty of whatever kind that such future events will occur or that they will occur as described herein, or that such results will be achieved by the fund or the investments of the fund, as the occurrence of these events and the results of the fund are subject to various risks and uncertainties. The actual portfolio, and thus results, of the fund may differ substantially from those assumed in the forward looking statements. The manager and its affiliates will not undertake to update or review the forward looking statements contained in this presentation, whether as result of new information or any future event or otherwise.

China’s “Currency Manipulation”—A Sign of Panic or a Cunning Plan?

  |   For  |  0 Comentarios

China's "Currency Manipulation"—A Sign of Panic or a Cunning Plan?
Pixabay CC0 Public DomainFoto: PxHere CC0. La "manipulación de divisas" de China: ¿una señal de pánico o un plan astuto?

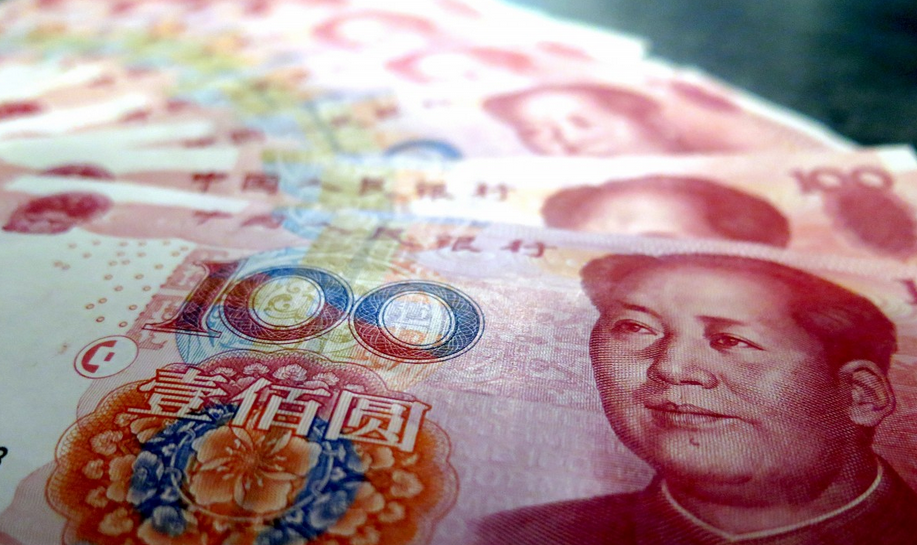
Over the past several months, there has been hype about the prospect of the Chinese renminbi (RMB) weakening past 7 per U.S. dollar, despite no evidence that 7 is a magical number. China’s central bank, People’s Bank of China (PBOC), had denied that it was focused on defending 7, and the IMF said it wasn’t significant. So when the RMB finally broke 7, the media treated it as a dramatic event, but I believe, this will soon pass.

It is likely that the timing of the move was deliberate, following President Trump’s latest round of tariffs last week.

A sign of panic?

In a Monday morning tweet, President Trump responded to a depreciating Chinese renminbi by stating, “It’s called ‘currency manipulation.’ ”

The decision to tag China as a currency manipulator was either a sign of panic, or a cunning plan. Or a bit of both.

My interpretation of yesterday’s tweet is that the president still wants to sign a trade deal with Chinese President Xi, because Trump recognizes that a deal is better than no deal for his re-election prospects.

No deal would mean continued taxes on Chinese goods, paid for by American families. (And the next round of tariffs would fall largely on consumer goods, which had previously been spared because of the direct impact on voters.) No deal would mean a continued Chinese boycott of American soybeans, which is contributing to harsh conditions for farmers in politically important states. No deal would mean continued economic uncertainty, which is leading to weaker corporate capex and worries about a recession. Moreover, the prospect of no deal, and an escalation of the tariff dispute into a full-blown trade war, has had a clear, negative impact on investor sentiment.

I believe Trump wants a deal, but is struggling to find a way to close the deal.

Given that the currency manipulator label carries no concrete consequences, Xi is unlikely to feel more pressure to sign a deal that he believes is disadvantageous. He may see the accusation as a sign of panic. I believe the timing of latest currency move was a short-term political signal by Xi.

Xi is unlikely to resort to a significant devaluation to respond to Trump, in my view. The tariffs are having little direct impact on China’s economy (net exports were less than 1% of China’s GDP last year, and only 20% of total exports went to the U.S.), and Xi has far better tools to deal with the more significant indirect impact: weak confidence by manufacturers, who have slowed output and deferred investment. Further, China’s consumer story—the largest part of its economy—remains pretty healthy, as does employment and wage growth, so there is no reason for Xi to panic.

A cunning plan?

In the past, Treasury Secretary Steven Mnuchin ignored the president’s calls to tag China as a currency manipulator. And when the law required a formal ruling on the question, Mnuchin—following in the footsteps of many Democratic and Republican predecessors—declared that China was not a manipulator.

His last finding was just a few months ago, on May 28, when Mnuchin informed Congress that China did not meet the criteria for being designated as a currency manipulator under either the 1988 or 2015 legislation.

Yesterday, however, just several hours after Trump’s tweet, Mnuchin issued a press release designating China as a currency manipulator under the 1988 legislation. “In recent days, China has taken concrete steps to devalue its currency…to gain an unfair competitive advantage in international trade,” according to the press statement.

What changed between May 28 and Monday that led Mnuchin to reverse course?

During that period, the RMB depreciated by all of 0.4% against the dollar. Was that enough to justify a change in policy? Was that sufficient to provide, as the Treasury press release claimed, “an unfair competitive advantage in international trade.”

The timing of Xi’s decision to relax his central bank’s interventions that had for many months prevented market forces from pushing the RMB below 7 was clearly politically motivated, in response to Trump’s August 1 announcement of additional taxes on Chinese goods. But this market pressure itself was the result of uncertainty created by the Trump tariffs, and Xi’s action was modest: The PBOC lowered its target rate for the currency by only 0.3%, although market forces pushed it down further.

Here’s another way to look at it: between Trump’s August 1 announcement of additional taxes and Monday’s currency manipulation decision, the RMB depreciated 0.3% against the dollar.

Yet another perspective: over the course of 2019, the RMB is behaving as it has in recent years, with its direction vs. the dollar determined by the strength or weakness of the dollar. Year to date, the RMB is down 1.5% vs. the dollar, while the U.S. Dollar Index (DXY) is up 1.5%.

(China has in fact been manipulating its currency to stop market forces from weakening it even more. The Trump administration wants them to stop? And on Tuesday, China’s central bank guided the exchange rate a bit higher, consistent with its statement that they are “not carrying out competitive devaluation.”)

It is fair to conclude that little has changed since the Treasury’s May 28 decision that China did not meet the legislative criteria for currency manipulation.

So, did Mnuchin change course yesterday simply due to pressure from his boss?

Or, was it part of a cunning plan?

Yesterday’s press release says, “As a result of this determination, Secretary Mnuchin will engage with the International Monetary Fund to eliminate the unfair competitive advantage created by China’s latest actions.” Well, we know that the IMF believes the RMB is roughly fairly valued, so this is unlikely to worry Xi.

Did Mnuchin decide that designating China as a manipulator might calm the president without blowing up the trade talks, because there are no consequences to the designation? Mnuchin may have decided that this course of action would lead Trump to give U.S. Trade Representative Robert Lighthizer and him more time to negotiate with their Chinese counterparts, in an effort to reach the deal that Trump knows he needs, but doesn’t know how to achieve.

If they are given room to negotiate, I think a deal can be reached by the end of the year, as I believe that Xi continues to want to reach a deal. While tariffs are not a huge problem, as China is no longer an export-led economy, failure to conclude a deal would open up the risk that a full-blown trade war leads to restrictions on China’s access to American tech, everything from semiconductors to research collaboration. That would be a setback to China’s economic growth, which Xi wants to avoid.

Column by Matthews Asia, written by Andy Rothman, Investment Strategist

Negative Interest Rates are Forever?

  |   For  |  0 Comentarios

¿Los tipos de interés negativos son para siempre?
Pixabay CC0 Public Domain. Negative Interest Rates are Forever?

European interest rates are edging further into negative territory bringing down Fixed Income yields across the board. Returns on certain investment maturities are now negative from government bonds to junk debt instruments. In the Eurozone, the remuneration of time and credit risk has become a thing of the past. Euro bond investors grapple to capture some short-term capital gain from this downward interest rate trend, knowing full well the losses facing them over the long term by holding these instruments to maturity.

As the European Central Bank (ECB) awaits its new president Mme Lagarde, the rhetoric from its outgoing management is for more accommodation, through lower interest rates, a return to Quantitative Easing, maybe both. Negative rates in Europe seem set to continue past Mr Draghi’s mandate.

It is difficult to see the point of such a policy. If this intervention provides support to European markets on the one hand, it destroys the existing savings pool through negative absolute and real interest rates on the other. Surely, the idea behind any Capitalist system is the creation of wealth through the remuneration of Capital, and not some absurd artificial liquidity injections, which ultimately work to undermine it.

So why has the ECB chosen this approach? Their announced objective has been to stabilize the European financial system. This institution’s policy intervention has also greatly reinforced their direct and indirect monetary control. The ECB oversees the European banking industry as its regulator. It influences bond and other asset prices in European financial markets through its interventionist monetary policy. It provides most of the funding for individual sovereign Eurozone member states.

However, the ECB is now subject to a certain number of constraints. By putting itself in the financial driving seat, this institution is in the spotlight to avoid disorderly European financial markets (a role the Bank of Japan knows all too well), as well as having to contend with internal political resentment to this ‘monetary control’ paradigm. Over time, this situation could trap the ECB into providing never ending accommodative support thereby condemning European savers to suffer from negative interest rates for a very long period of time.

Column by Steven Groslin, Executive Board Member and Portfolio Manager at ASG Capital

In The First Half Of The Year Mexico Saw 7 New Ckds And Cerpis

  |   For  |  0 Comentarios

Llegan a siete los CKDs y CERPIs que surgen en México durante el primer semestre
Foto: Dennis van Zuijlekom. In The First Half Of The Year Mexico Saw 7 New Ckds And Cerpis

A total of 7 CKDs* were issued in the first half of 2019, of which 5 were CERPIs.  Together, they add up to 1.595 million dollars of which only 366 million dollars have been called.

The 7 issuers of the first half of 2019 were five CERPIs: Mexico Infrastructure Partners (energy); SPRUCEVIEW MEXICO (private equity), Blackstone (fund of funds), ACTIS GESTOR (fund of funds) and Harbourvest Partners (fund of funds). And two CKDs: Walton Street Capital (real estate) and ACON (private capital).

Of these issuers:

  1. For Walton Street Capital, is its fourth CKD that issues individually to reach total commitments of $ 1.274 billion USD in the real estate sector without considering the CKD that they jointly issued with FINSA in 2015.
  2. In the case of Mexico Infrastructure Partners, is its fifth issue (3 CKDs and 2 CERPIs) to complete total commitments for 728 million dollars in the infrastructure and energy sector.
  3. For Blackstone is its fourth CERPI as an issuer in the fund of funds sector that allows it to add commitments for 717 million dollars.
  4. Finally, the issuance of ACON, it is an option to acquire Series B certificates for AFOREs holding the previous CKD (ACONCK 14).

The number of issuers for the same period of 2018 (first half) was 10 (9 CKDs and one CERPI) out of a total of 38 that were issued throughout 2018. The total amount placed in 2018 was 1.649 million dollars and commitments for 6.869 million dollars. After the explosive offer of CERPIs observed in 2018 (18 in total), in the first six months of 2019 (5) it is observed that the offer takes a slower pace of growth.

The 13.098 million worth of the CKDs and CERPIs market through 133 issues represent 0.9% of GDP. The 109 CKDs in circulation are equivalent to 80% of the resources committed, while the 24 CERPIs in circulation represent 20% of the total.


The largest number of CERPIs issues continues to be funds of funds (13 of the 24 total CERPIs that have been placed), while 6 are private equity, 3 of infrastructure and the ones with the least supply have been those of energy and real estate of which only one of each has been placed.
According to the quarterly publication of CKDs & CERPIs made by 414 Capital as of July 2019, ), there is a total of 38 CKDs in pipeline that have made the process as issuer with the Mexican regulator (National Banking and Securities Commission or CNBV) of which 7 are CERPIs. With the intention of issue since 2016 there is one, while there are 11 of 2017, 14 of 2018 and 12 of 2019 which reflects the interest of many to issue. Historically there are few CKDs and CERPIs that issue in the first year.

Although this year is the beginning of a new public administration, the offer of alternative investments has been maintained through CKDs and CERPIs.

Column by Arturo Hanono

*CKDs are private equity funds that are issued in the stock market through a trust, which allows institutional investors such as AFOREs and insurance companies, among others, to participate in this asset class. In 2009 the first CKD (RCOCB_09) was issued. CKDs only invest in projects in Mexico. Although the first CERPI arises in 2016 (MIRAPI_16) it is in 2018 when 90% of the projects in which they invest are allowed to be abroad and 10% in Mexico. This situation is what causes the rise of CERPIs.

Attributes And Inadequacies Of The New “Generational Funds” Of The Mexican Pension System

  |   For  |  0 Comentarios

¿Qué atributos e insuficiencias suponen los nuevos “Fondos Generacionales” del SAR?
Foto: MaxPixel CC0. Attributes And Inadequacies Of The New “Generational Funds” Of The Mexican Pension System

Target date funds (TDF), renamed “Fondos Generacionales”, Generational Funds (GF) by Consar, the Mexican regulator, involve more qualities than the Siefores Básicas (SB), those restricted regime pension funds. As is known, in the United States, TDF are considered for the “401 (k)” pension plans, as one, not the only one, of the good products to be chosen by the employees, who decide how to invest their savings.

To gauge how important they have become, we can see their weight in the balance of the accounts: 20% at the end of 2016, according to www.ici.org. It should be considered that they are the investment by default, the fate that is given to the money of those who do not choose any product, and that were enthusiastically promoted by the Obama administration.
 

How do the TDF work? What will the GF be like?

TDF are funds of funds to balance risk and return. At the beginning of the working life, when the employees are young, portfolios are 100% invested in equity (“E”) under the premise that, the younger, the more tolerance to risk and more time to recover from debacles. TDF point to a defined year, which usually carry by name, for example, Vanguard Target Retirement 2040 Fund, “VFORX”, for workers to retire between 2038 and 2042. Halfway through the cycle its composition reveals the pendulum or sense: the equilibrium of risks: 83% in “E” (index funds with more than 10,000 shares) and 17% bond funds (“FI”).
 

The GF of Mexican Pension System (SAR) will invest directly in equity, bonds and other assets. Its non-mandatory cap of “E” will be 60%. By adding structured assets (“SA”) and local Reits (“R”) could reach 90% in high risk.  Yes, the non-mandatory nature means GF could be composed just with “FI” assets, 100%, all the time. New funds will be identified by the range of years –properly, the “generation” – in which the workers were born; for example, “Sociedad de Inversión Básica 75-79”, for contemporaries of the Americans of the 2040 target.

In a simple way: instead of moving the employee by age in a staggered way from SB4 to SB1, from higher to lower risk (from 45% to 10% maximum in “E”), his only GF will be the one that adjusts the equity parameters, from maximum of 60 % to limit of 15%, according to its productive stage.
What is the disputable of the TDF?

  • The large load on risk assets, potentially the most profitable, is carried out over low balances. As the balance swells the load falls. Thus, the higher profitability is expected on sums that influence little to increase the savings. Several studies reveal that if the percentage of risk is not altered or if it is increased gradually (contrary to what is intended), better results are achieved.
  • The analysis and exercises of Javier Estrada (“The Glidepath Illusion: An International Perspective”, 2013) are enlightening: “simple alternatives… contrarian, equity-driven, and balanced strategies… provide investors with higher expected wealth at retirement and generally higher upside potential, than lifecycle strategies”. The uncertainty, concludes the meticulous Estrada, is “…about how much better, not how much worse, investors are expected to fare with these alternative strategies”.

“Generational Funds” of SAR: more controversial than TDF

  • Observations on the incidence of “E” and “FI” in TDF will apply to GF. The optional cap of 60%, without considering “SA” and “R”, of slow maturation, will influence a meager balance, given by few weeks of history and small/medium contributions; meanwhile, the “FI” will apply on a large balance, the result of years of accumulation and substantial contributions for higher salary, and consequently will weigh much more.
  • Those who are going to retire around 2040 could today have up to 30% of “E” in SB2. As of December of this year they could have 53% to 47% (without “SA” or “R”), if the Afores exploit the permitted ceiling, which seems difficult, considering the evolution of the system’s investments. Meanwhile, their US counterparts assume 83% of pure “E” with VFORX, and 66% broadly and weighted, according to 401 (k) *.
  • What remains unchanged: Investment in “E” and other highly risky assets will continue to be optional, contrary to the sense of the TDF and differentiated from Chilean pension funds that maintain high mandatory minimums.
  • See that Mexican pension system’s exposure to risky assets in May (“E” + “SA” + “R”) was 26.4%; that of SB4, the riskier, 33%. On the other hand, to March, the equity of the Chilean pension funds was 39.4%; that of the riskier, “A” fund, 80%.
     

The maximum historical proportion of SAR in “E” did not exceed 25%; that of SB4, of 34%. The one of “F” does not raise, that of Commodities was only to appear (see “Las adecuaciones al régimen del SAR no han generado cambios sustanciales en las inversiones de las Siefores”).   It remains to be seen how much of the new regime the managers exploit. Is it possible that some will also maintain minority portions of “E” in the new “GF”?

Column by Arturo Rueda

** Calculated with the equity composition of VFORX and data from the table “Average Asset Allocation of 401(k) Plan Accounts. 2016”: [(83% x 11.90%) + 43.10% + 6.50%] = 66.07%